Introduction
Lots have been written lately about stagflation. Since I have written an article on “Inflation” (https://www.gfmi.com/articles/everything-you-wanted-to-know-about-inflation-but-were-afraid-to-ask/) and a blog on “Predicting Recessions” (https://www.gfmi.com/the-long-and-short-predicting-recessions/), I thought I would combine them with an update using today’s economic variables. This article assumes you have read both the prior inflation article and the blog – or have a good foundational knowledge of capital markets and economic variables. To be sure we are all on the same page, here is a definition of stagflation: prices for goods and services are increasing while the economy is not growing.
Inflation
By any measure, inflation is a problem. Here are the economic releases showing the levels of inflation including CPI, PPI and PCE, and their corresponding levels of less food and energy (note the BLS also releases two core measures for PPI).
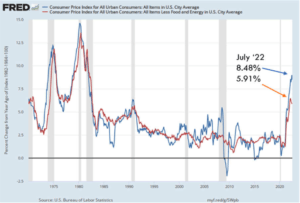
Sources: U.S. Bureau of Labor Statistics, Consumer Price Index for All Urban Consumers: All Items in U.S. City Average [CPIAUCSL], retrieved from FRED, Federal Reserve Bank of St. Louis; https://fred.stlouisfed.org/series/CPIAUCSL, August 26, 2022.
U.S. Bureau of Labor Statistics, Consumer Price Index for All Urban Consumers: All Items Less Food and Energy in U.S. City Average [CPILFESL], retrieved from FRED, Federal Reserve Bank of St. Louis; https://fred.stlouisfed.org/series/CPILFESL, August 26, 2022.
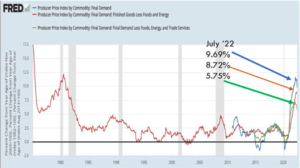
Source: U.S. Bureau of Labor Statistics, Producer Price Index by Commodity: Final Demand: Final Demand Less Foods, Energy, and Trade Services [WPSFD49116], retrieved from FRED, Federal Reserve Bank of St. Louis; https://fred.stlouisfed.org/series/WPSFD49116, August 26, 2022.
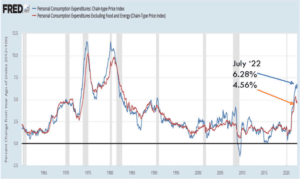
Source: U.S. Bureau of Economic Analysis, Personal Consumption Expenditures Excluding Food and Energy (Chain-Type Price Index) [PCEPILFE], retrieved from FRED, Federal Reserve Bank of St. Louis; https://fred.stlouisfed.org/series/PCEPILFE, August 26, 2022.
A few points here:
- By any measure, inflation is historically high.
- The supply chain is supposedly easing, which should alleviate some cost pressures.
- The ongoing movement toward onshoring will in all likelihood add to price pressure1.
- Oil is a wild card.
- The Federal Reserve has congressionally mandated goals of maximum employment and price stability. Price stability is code for controlling inflation!
- Inflation is well above the Federal Reserve’s target of 2%.
- Chair Powell made it very clear in Friday’s (August 26, 2022) speech at Jackson Hole that inflation is a top priority. Clearly, there are more interest rate increases that lie ahead2.
Another area of concern is the increase in wages. Every client I speak with mentions how the pay scale has increased, whether it is for operational personnel or programmers. From unions to new hires, across the economy, wages are climbing higher. Increased income will give folks some serious buying power, assuming it is not eroded by inflation. This is a huge assumption! And you know what they say when you assume…
Recession
Once again, negative yield curves have been getting a great deal of attention over the past several months. The chart below shows the U.S. Treasury 10-year note minus the U.S. Treasury 3month bill. In the chart, when the line falls below “0” indicating an inversion, a recession ensues. This has held true for each recession since 1970.
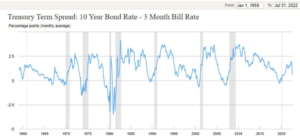
Source: https://www.newyorkfed.org/research/capital_markets/ycfaq.html#/interactive
The chart below illustrates the same spread but includes data up to August 29, 2022. Technically the curve never inverted but came awfully close in mid-August and again is approaching inversion!

Source: https://ycharts.com/indicators/10_year_3_month_treasury_spread
Interestingly, the press has focused more on the 10-year Treasury minus the 2-year Treasury, which doesn’t have quite the same track record of 10-year minus 3-month bills (these are constant maturity observations) but does show a recession is coming.
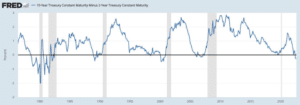
Source: Federal Reserve Bank of St. Louis, 10-Year Treasury Constant Maturity Minus 2-Year Treasury Constant Maturity [T10Y2Y], retrieved from FRED, Federal Reserve Bank of St. Louis; https://fred.stlouisfed.org/series/T10Y2Y, August 28, 2022.
Institute of Supply Management Purchasing Managers Index
(ISM PMI)
Here is the July 2022 update for the ISM/PMI:
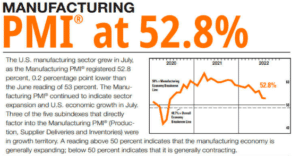
Source: https://www.ismworld.org/globalassets/pub/research-and-surveys/rob/pmi/rob202208pmi.pdf
According to this survey, the economy is expanding but is heading in the wrong direction as the chart indicates the trend in growth is slowing.
Consumer Sentiment
There are two indicators tracking consumer confidence/sentiment: the Consumer Confidence Survey® produced by the Conference Board and the University of Michigan Index of Consumer Sentiment.
The Consumer Confidence Survey® reflects prevailing business conditions and likely developments for the months ahead. This monthly report details consumer attitudes and buying intentions, with data available by age, income, and region.
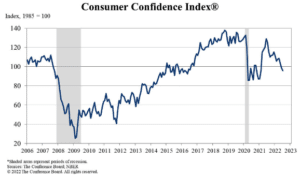
Source: https://www.conference-board.org/topics/consumer-confidence
The University of Michigan Index of Consumer Sentiment surveys have long stressed the important influence that consumer spending and saving decisions have in determining the course of the national economy. The Surveys of Consumers have proven to be an accurate indicator of the future course of the national economy3.
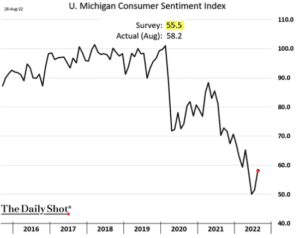
Source: The Daily Shot -August 29, 2022
Both indexes indicate a downtrend in consumer views toward the economy although the University of Michigan consumer sentiment index has turned upwards over the past couple of months, the overall trend is clearly down.
Gross Domestic Product
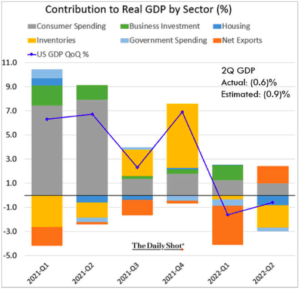
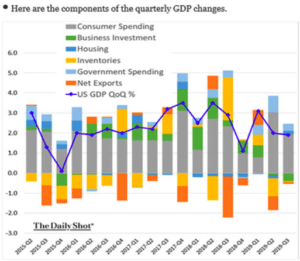
The following two charts show the contribution to real GDP by sector (%). The first chart shows that in the first two quarters of 2022, the U.S. experienced negative growth in GDP. Two consecutive quarters of negative growth would be classified as a technical recession. The second chart is the same chart from the previous blog indicating how important the consumer is to the economy. If the consumer stops spending, the economy is in deep trouble.
Source: WSJ Daily Shot Oct. 29, 2019
Sahm Recession Indicator
In our blog “Predicting Recessions” we introduced the new kid on the block for predicting recessions, the Sahm Recession Indicator. It is really pretty simple. The concept is that when the economy starts heading south, employers start laying off staff. This indicator captures the change relative to the previous 12-month low in unemployment. As the St. Louis Fed website states:
“Sahm Recession Indicator signals the start of a recession when the three-month moving average of the national unemployment rate (U3) rises by 0.50 percentage points or more relative to its low during the previous 12 months.”
The indicator clearly has not crossed over this 0.50 threshold.

Source: Sahm, Claudia, Real-time Sahm Rule Recession Indicator [SAHMREALTIME], retrieved from FRED, Federal Reserve Bank of St. Louis; https://fred.stlouisfed.org/series/SAHMREALTIME, August 24, 2022.
Conclusion
So, there you have it. As chair Powell stated on Friday, August 26, 20224: “The Federal Open Market Committee’s (FOMC) overarching focus right now is to bring inflation back down to our 2 percent goal.” Looking at the inflation charts above, there is a lot of work to do.
He further went on to state:
“Restoring price stability will take some time and requires using our tools forcefully to bring demand and supply into better balance. Reducing inflation is likely to require a sustained period of below-trend growth. Moreover, there will very likely be some softening of labor market conditions. While higher interest rates, slower growth, and softer labor market conditions will bring down inflation, they will also bring some pain to households and businesses. These are the unfortunate costs of reducing inflation. But a failure to restore price stability would mean far greater pain.”
I don’t think there is any doubt about the future of short-term rates. But the key question to consider is what will happen to long-term rates? Will the markets perceive the Fed is doing enough to bring down inflation? Or, will it be the opposite?
In my opinion, if the Fed does not tackle the inflation issue, the global markets will lose confidence in the Fed. This will have catastrophic consequences for the economy, U.S. dollar, and the U.S.’s ability to raise funds.
So far, the good news is the Sahm Recession Indicator is not indicating an immediate recession. On the other hand, some of the other indicators appear to pointing to recession down the road. A lot will rest with the U.S. consumer and their reaction to higher interest rates. Only time will tell.
Bottom line: It looks like a strong probability we are heading into a period of stagflation or, given the Fed’s resolve on inflation, it seems like an outright recession is also a possibility.
References
1For more information on onshoring vs. offshoring go to:
https://www.gfmi.com/articles/offshoring-outsourcing-onshoring-supply-chain-and-baby-formula/
2For more on the Federal Reserve and their tools go to:
https://www.gfmi.com/articles/the-federal-reserves-tools-to-manage-monetary-policy/
3Source: https://data.sca.isr.umich.edu/fetchdoc.php?docid=24774
4For Powell’s entire speech go to:
https://www.federalreserve.gov/newsevents/speech/powell20220826a.htm
About the Author: Kenneth Kapner

Ken Kapner, CEO and President, started Global Financial Markets Institute, Inc. (GFMI) a NASBA certified financial learning and consulting boutique, in 1998. For over two decades, Ken has designed, developed and delivered custom instructor led training courses for a variety of clients including most Federal Government Regulators, Asset Managers, Banks, and Insurance Companies as well as a variety of support functions for these clients. Ken is well-versed in most aspects of the Capital Markets. His specific areas of expertise include derivative products, risk management, foreign exchange, fixed income, structured finance, and portfolio management. He has been a Risk Management Advisor to a Mutual Fund’s Board of Trustees and has served as an Expert Witness using knowledge of derivatives, trading, and risk management.
Prior to starting GFMI in 1998, Ken spent 14 years with the HSBC (Hong Kong and Shanghai Banking Corporation) Group in their Treasury and Capital markets area where he traded a variety of instruments including interest rate derivatives, spot and forward foreign exchange, money markets; managed the balance sheet; sat on the Asset Liability Committee; and was responsible for the overall Treasury activities of the bank. He later headed up HSBC’s Global Treasury and Capital Markets Product training for two years in Hong Kong. Specifically, his responsibilities included developing new courses and delivering courses to traders, support staff, and relationship managers. In New York, he established a training department for the firms’ Securities Division where he was in charge of the MBA Associates Program, continuing education, and Section 20 license.
He has co-authored/co-edited seven books on derivatives including The Swaps Handbook and Understanding Swaps.
Publications and Articles
Articles
2022 CME Cryptocurrency Futures
2021 The Federal Reserve’s Tools to Manage Monetary Policy and Everything You Wanted to Know About Inflation but Were Afraid to Ask
2020 Modern Monetary Theory: The Federal Reserve, Inflation, and the US Dollar
2019 3-Month SOFR Futures and LIBOR Schmibor: What’s Next? SOFR Part I and Part II
2018 VIX, Volatilities, and Exchange Traded Products and Settlement Risk and Blockchain
2017 Electronic Trading and Flash Crashes – Part I and Part II
2016 The Long and Short of IT: An Overview of XVA, The Long and Short of IT: An Overview STACR and CAS, The Federal Reserve Tolls: Past and Present, The Perfect Storm: October 2008, and Interest Rate Swap Futures: An Introduction
2014 Risk Reversals
2002 Futures Magazine, Doing Your Homework on Individual Equity Futures (Co-written with Robert McDonough)
Blog
Ken also edits and writes for the GFMI Blog.
Books
1996 Como Entender Los Swaps (co-author: John Marshall), published by CECSA (a Mexican publishing firm). This is a translated edition of our book Understanding Swaps, but with adaptations to fit the Mexican markets. (289 pages)
1993 The Swaps Market: 2nd edition, Kolb Publishing, 288 pages (co-author: John Marshall, copyright 1993). This book is directed to the graduate business student.
1993 Understanding Swaps, John Wiley & Sons, 270 pages (co-author John Marshall, copyright 1993). This book is directed to the practitioner market and is published as part of Wiley’s Finance Series.
1993 1993-94 Supplement to the Swaps Handbook, New York Institute of Finance, a Simon & Schuster Company, 494 pages, (co-authors John Marshall and Ellen Lonergan, copyright 1993). This book is directed to a practitioner audience and is a supplement to The Swaps Handbook. My role was largely that of editor.
1991 1991-92 Supplement to The Swaps Handbook, New York Institute of Finance (Simon & Schuster Professional Information Group), 300+ pages (co-author: John Marshall copyright 1992). This book is directed to a professional practitioner audience and is an annual supplement to The Swaps Handbook.
1990 The Swaps Handbook: Swaps and Related Risk Management Instruments, New York: New York Institute of Finance, a Simon & Schuster Company, 543 pages. (co-author: John Marshall). This book is directed to derivative product professionals.
1988 Understanding Swap Finance, Cincinnati: South Western publishing Company, 155 pages. (co-author John Marshall, copyright 1990). This was the first academic text published on the swaps markets.
Affiliations
International Association of Financial Engineers Board of Advisors – 1994 – 2010
Global Association of Risk Professionals
ATD National and New York Chapters
Copyright © 2022 by Global Financial Markets Institute, Inc.
23 Maytime Court
Jericho, NY 11753
+1 516 935 0923
www.GFMI.com
Download article My Cart