

Over the last year, there has been a lot pf press regarding negative yield curves and the ability of an inverted curve to predict a recession. There are other indicators that market practitioners use to foretell a recession, such as the ISM purchasing managers’ report and consumer sentiment. Now there is a new kid on the block, The Sahm Recession Indicator, which is based on unemployment.
Before exploring the forecasting ability of this new indicator, let’s quickly review a few of the common indicators that have been used.
Negative Yield Curve
Negative yield curves have been getting a great deal of attention over the past several months. A negative yield curve occurs when the yield on a longer dated U.S. Treasury falls below the yield on a shorter maturity. The press has focused on the 10-year T-note minus the 3-month T-bill presumably because the Federal Reserve uses this in a model to predict recessions. The chart below shows the U.S. Treasury 10-year note minus the U.S. Treasury 3-month bill. In the chart, when the line falls below “0” indicating an inversion, a recession ensues. This has held true for each recession since 1970.

Source: https://www.newyorkfed.org/research/capital_markets/ycfaq.html#/interactive
It is interesting to note, however, that to date, the U.S. Treasury 10-year note has not fallen below the U.S. Treasury 2-year note as shown on the following graph (these are constant maturity observations).
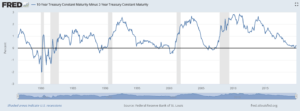
Source: St. Louis Fed
This relationship has also been a good predictor of recessions however in this case, it is not indicating a recession unless “almost” counts! But one has to wonder how much the Fed’s Quantitative Easing program, i.e., buying U.S. Treasuries and Agency Mortgage Backed Securities (MBS) has overly exaggerated the impact that increased demand for these securities has had on lowering their yields and hence, contributing to an inverted yield curve. Has this artificial buying minimized the forecasting ability of the yield curve?
Institute of Supply Management Purchasing Managers Index (ISM PMI)
Another indicator is the ISM PMI. When the index falls below 50, it implies that the manufacturing sector is contracting which often leads many economists to ask whether PMI is predicting a recession. However, as the ISM website states:
A PMI® above 42.9 percent, over a period of time, generally indicates an expansion of the overall economy. Therefore, the October PMI® of 48.3% indicates growth for the 126th consecutive month in the overall economy, and the third month of contraction following 35 straight months of growth in the manufacturing sector. “The past relationship between the PMI® and the overall economy indicates that the PMI® for October (48.3 percent) corresponds to a 1.6-percent increase in real gross domestic product (GDP) on an annualized basis,” says Fiore.
(Source: https://www.instituteforsupplymanagement.org/ISMReport/MfgROB.cfm)
One has to think the trend of three straight months of contractions may be a harbinger of a recession.
Consumer Sentiment
There are two indicators tracking consumer confidence/sentiment: the Consumer Confidence Survey® produced by the Conference Board and the University of Michigan Index of Consumer Sentiment.
The Consumer Confidence Survey® reflects prevailing business conditions and likely developments for the months ahead. This monthly report details consumer attitudes and buying intentions, with data available by age, income, and region.
(Source: https://www.conference-board.org/data/consumerconfidence.cfm )
The University of Michigan Index of Consumer Sentiment surveys have long stressed the important influence that consumer spending and saving decisions have in determining the course of the national economy. The Surveys of Consumers have proven to be an accurate indicator of the future course of the national economy.
(Source: http://www.sca.isr.umich.edu/)
As standalone gauges, the indicators are helpful in help in forecasting the economy. However, when they diverge as per the following chart, it may lead to a recession. The current reading does not seem promising.
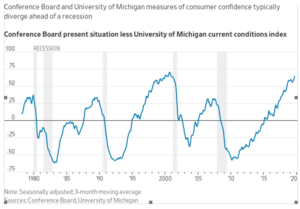
If you are not sure about the power of the consumer, the following chart indicates their impact on the economy. If the consumer stops spending, the economy is in deep trouble.
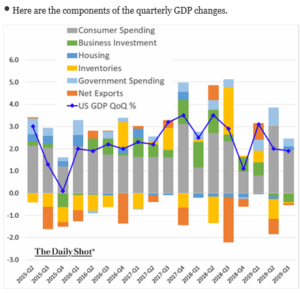
Source: WSJ Daily Shot Oct. 29, 2019
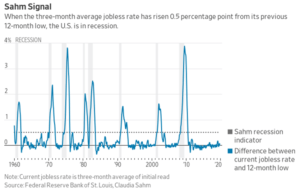
Sahm recession Indicator
Which brings us to the final and newest indicator, the SAHM Recession Indicator. It is really pretty simple. The concept is that when the economy starts heading south, employers start laying off staff. This indicator captures the change relative to the previous 12-month low in unemployment. As the St. Louis Fed website states: Sahm Recession Indicator signals the start of a recession when the three-month moving average of the national unemployment rate (U3) rises by 0.50 percentage points or more relative to its low during the previous 12 months.
(Source: https://fred.stlouisfed.org/series/SAHMREALTIME)
So, there you have it. The good news is the Sahm Recession Indicator is not indicating an immediate recession. On the other hand, some of the other indicators appear to pointing to recession down the road. Only time will tell.
If you’d like to learn more about these economic indicators, let us know. GFMI offers a number of economic courses for new and more experienced capital markets participants alike.