
Inflation
The press is abuzz with inflation news. Since the great recession, inflation has been extremely low, primarily registering below the Federal Reserve’s target of 2%. Recently though, inflation has increased above the Fed’s target with the Consumer Price Index coming in at over 5% for two straight months. The Fed has indicated that they are willing to tolerate higher inflation given the low inflation since late 2008. Market participants are unsure how to interpret their message. This article defines inflation, along with other terms associated with prices of goods and services, and reviews various inflation measurements, highlighting why it is so important for a central bank to keep inflation under control.
Definitions
Following are key terms to bear in mind when discussing inflation:
Inflation: Prices for goods and services are increasing.
Deflation: Prices for goods and services are decreasing. (Think of housing prices after the 2008 financial crisis, or the great depression in the 1930s.)
Disinflation: Prices for goods and services are increasing but at a decreasing rate.
Stagflation: Prices for goods and services are increasing and the economy is not growing. The United States experienced stagflation during the late 1970s.
Inflation Measurements
The three main inflation measurements are Consumer Price Index (CPI), Producer Price Index (PPI) and Personal Consumption Expenditure (PCE).
Consumer Price Index (CPI)
CPI is published by the U.S. Bureau of Labor Statistics (BLS) and defined as:
A measure of the average change over time in the prices paid by urban consumers for a market basket of consumer goods and services. Indexes are available for the U.S. and various geographic areas. Average price data for select utility, automotive fuel, and food items are also available1.
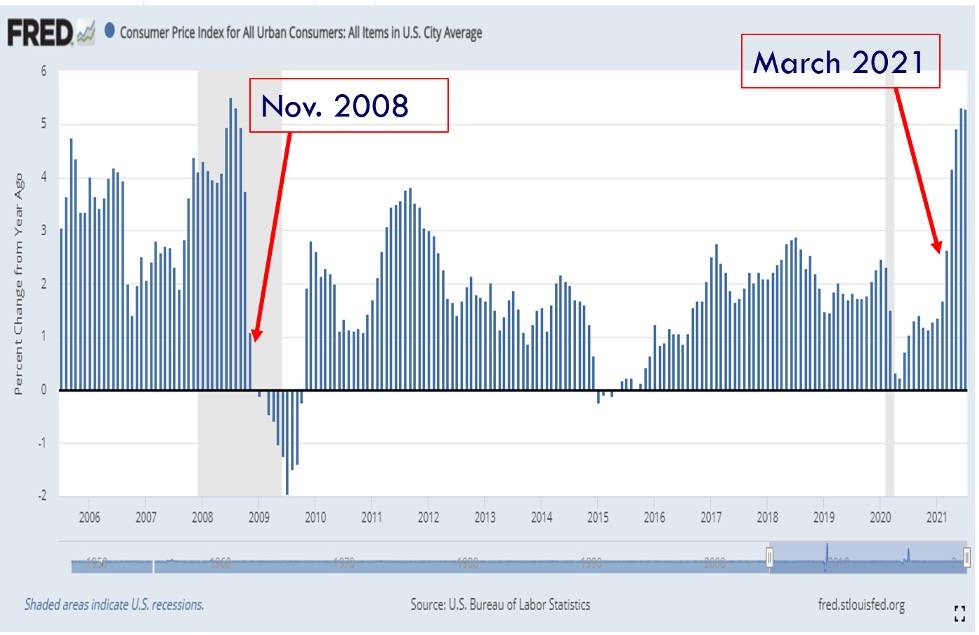
Figure 1 shows CPI from July 2005 through July 2021. Looking at the graph, it is easy to identify a few of the points that have already been made.
- From March 2021 through July 2021 inflation has been above 2% and June and July are above 5%
- From November 2008 through Feb. 2021 inflation has predominantly been below 2%
- During most of 2009, prices decreased, fitting into the definition of deflation
Figure 1: CPI
Ex Food and Energy, i.e., Core Inflation
All three indexes also measure inflation “less food and energy”. This is commonly referred to as “Core Inflation” with respect to the individual index. Core inflation is calculated because prices of food and energy tend to be volatile. The Federal Reserve and market participants generally will give core inflation more weight in their decision-making process as the volatility is usually considered transitory. Therefore, core inflation will give a better indication of the trend in prices. However, forecasting prices for food and energy and whether those forecasts are truly transitory, is key to determining future asset values. Why? The level of inflation will directly impact the Federal Reserve’s decision-making process on whether to increase or decrease interest rates. But more on this later.
Figure 2 shows the CPI ex food and energy. Not surprising, the numbers are lower than CPI but the recent spike is still above the 2% target range of the Federal Reserve.
Figure 2: CPI ex. Food and Energy
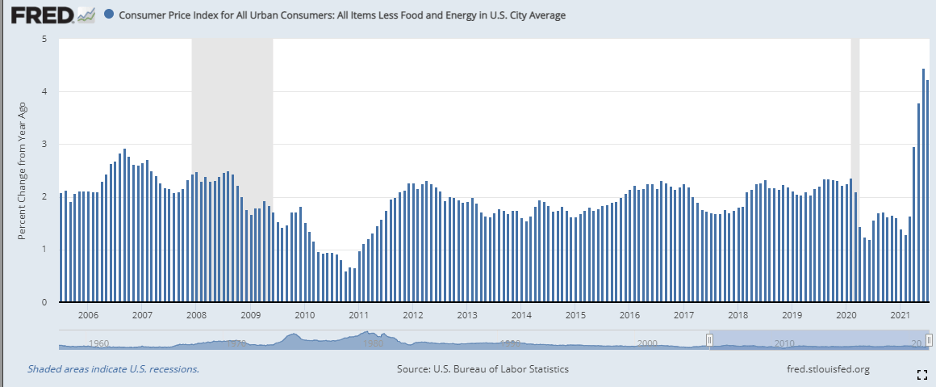
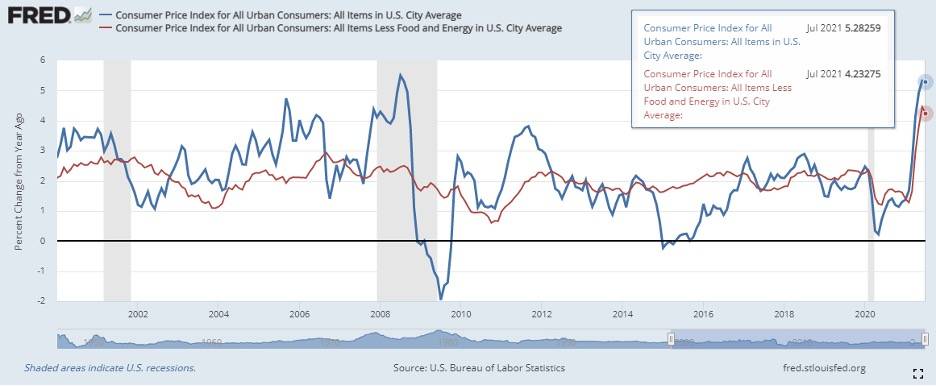
Figure 3 illustrates the volatility in CPI vs. Core CPI.
Figure 3: CPI and CPI less food and energy going back to 2000
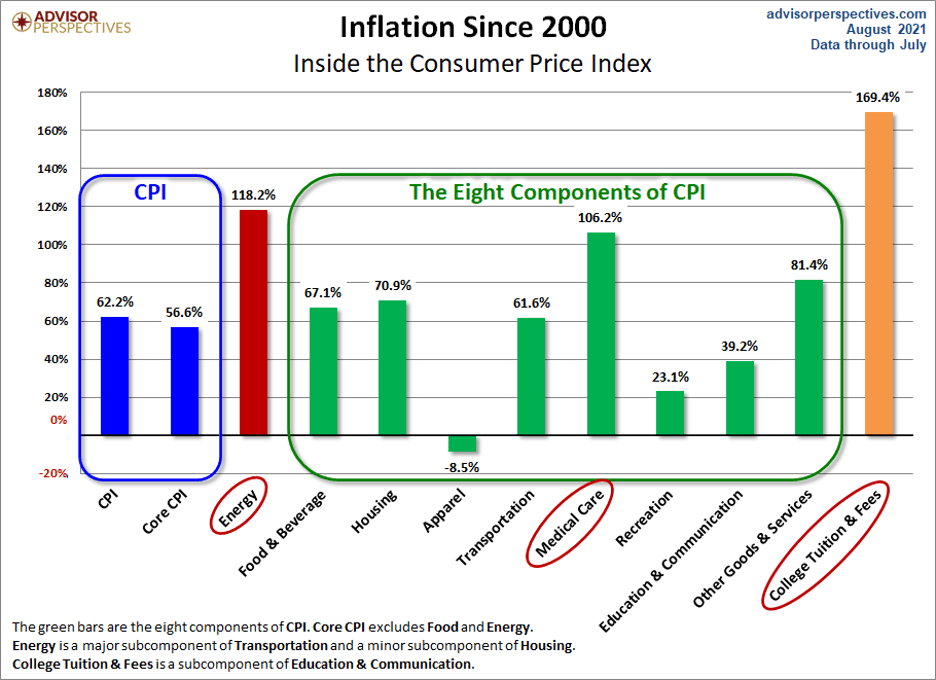
The chart in Figure 4 is a real eye opener in terms of the individual components impacting CPI.
Figure 4: Inside the CPI Components
Producer Price Index (PPI)
PPI is also released by the U.S. Bureau of Labor Statics and is defined as the following:
PPI measures the average change over time in the selling prices received by domestic producers for their output. The prices included in the PPI are from the first commercial transaction for many products and some services2.
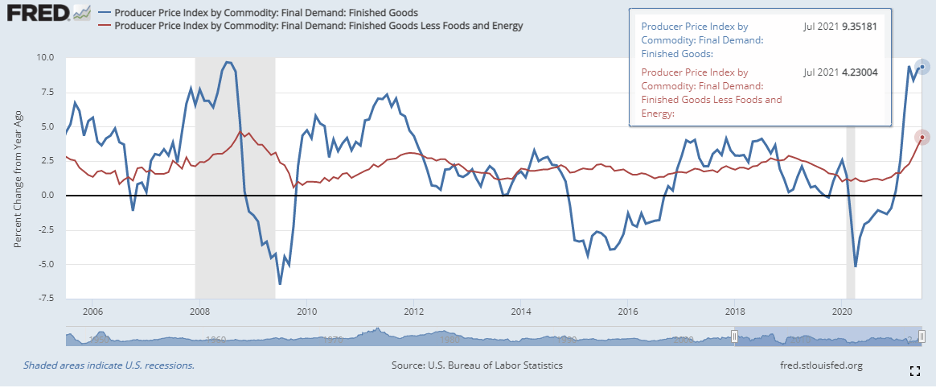
In Figure 5, we see the comparison of PPI vs. PPI less food and energy. Once again, the measurement that is less food and energy is less volatile than PPI.
Figure 5: PPI vs. PPI less food and energy
“While both the PPI and CPI measure price change over time for a fixed set of goods and services, the CPI and PPI differ for three main reasons:
- the composition of the set of goods and services,
- the types of prices collected for the included goods and services, and
- coverage of the services sector.”5
The bottom line is you are not exactly comparing apples to apples.
Personal Consumption Expenditures (PCE)
PCE is published by the Bureau of Economic Analysis (U.S. Department of Commerce) and is defined as:
A measure of the prices that people living in the United States, or those buying on their behalf, pay for goods and services. The PCE price index is known for capturing inflation (or deflation) across a wide range of consumer expenses and reflecting changes in consumer behavior.3
The important aspect of the PCE is that it is the Federal Reserve’s primary indicator for inflation.
“The FOMC judges that low and stable inflation at the rate of 2 percent per year, as measured by the annual change in the price index for personal consumption expenditures, is most consistent with achievement of both parts of the dual mandate.”4
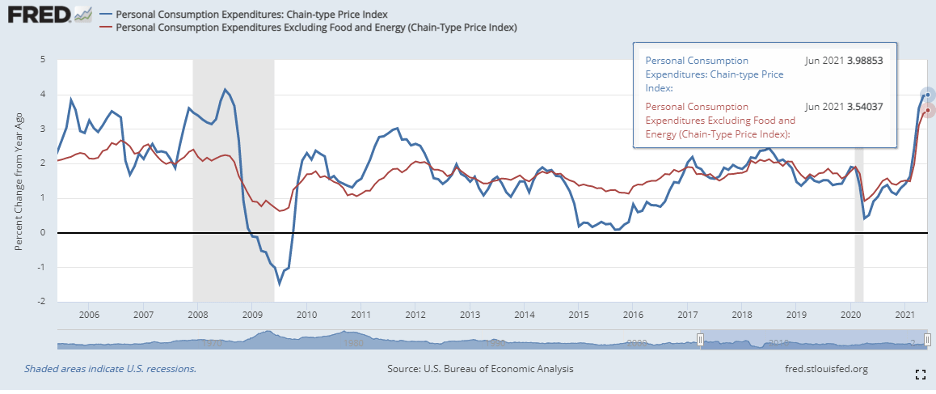
To round off the charts, Figure 6 shows the PCE vs. PCE less food and energy.
Figure 6: PCE vs. Core PCE
Inflation, Federal Reserve, and Monetary Policy
Assume for a moment your monthly income is $100. This can be broken down whereby living expenses are $98.00 and $2.00 is discretionary income. With this $2.00, you purchase your favorite item (mine would be chocolate!) every month. Now assume that your beloved product costs you $4.00, i.e., the price increase was 100%. You have to make a choice on how you want to spend your money. Do you want to dip into your living expenses or do you want to forgo your beloved product? Taking this theoretical example one step further, what if your living expenses also increased by 100% and your salary remained the same? The point here is that price increases can wreak havoc on one’s ability to purchase necessary goods and services in order to live. The goal of a central bank is to keep prices in check so that price increases are kept at a moderate level.
The Federal Reserve has two mandates: promote maximum employment and maintain price stability. To achieve their goal of keeping price increases in check, the Fed monitors a nominal target of 2% inflation using PCE.6 If inflation is too high, the Fed will raise interest rates and if inflation is low, then the Fed can lower interest rates.
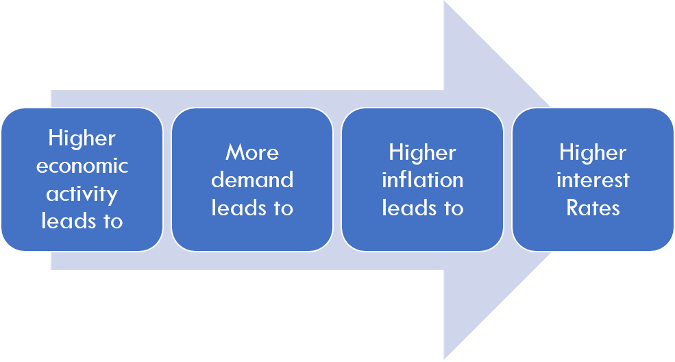
Generally speaking, there is a direct relationship between economic activity, inflation and interest rates. This can be summarized in the following two scenarios:
Scenario 1
Scenario 2
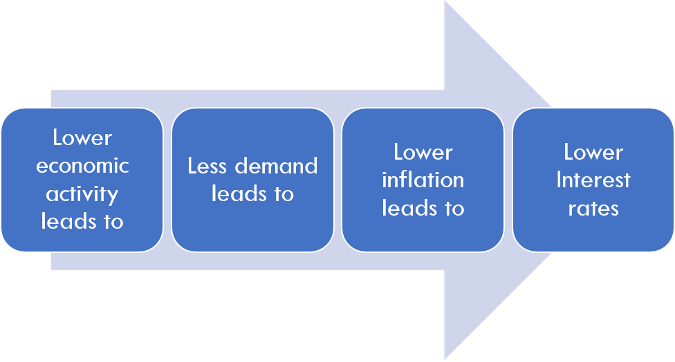
One of the Fed’s main tools is the Federal Funds7 rate. In Scenario 1, the Fed would increase the Fed Funds rate and in Scenario 2 they would decrease the Fed Funds rate. The change in Fed Funds will impact:
- Short and long-term interest rates
- Foreign exchange rates
- Equity values
- Asset values in general
- Peoples’ expectations impacting their households and businesses
The main question to ask, given the recent increase in inflation, is will this increase turnout to be transitory or permanent? Market participants are trying to figure out this exact question and how to position their portfolios. Good luck to them all!
Additional Insight on Inflation
How do market participants gain insight into the market’s expectation on inflation? They use nominal Treasury securities versus Treasury Inflation Protection Securities (TIPS) sometimes referred to as “linkers”. To gain more insight into Inflation Breakeven Rates, read GFMI’s article that is appropriately titled Understanding Inflation Breakevens.
References
1 See https://www.bls.gov/cpi/
2 See https://www.bls.gov/ppi/
5 For a more in-depth explanation see https://www.bls.gov/ppi/faqs/questions-and-answers.htm#1
7 The federal funds, or fed funds, is a U.S. domestic market where unsecured borrowing takes place between depository institutions and other institutions such as government sponsored enterprises, for example the FHLBs. The maturities are generally overnight. This market has evolved since the great recession. I will write more on this in next month’s article. For now, suffice it to say, it is a main tool for the Federal Reserve to control the level of interest rates.
About the Author: Kenneth Kapner

Prior to starting GFMI in 1998, Ken spent 14 years with the HSBC (Hong Kong and Shanghai Banking Corporation) Group in their Treasury and Capital markets area where he traded a variety of instruments including interest rate derivatives, spot and forward foreign exchange, money markets; managed the balance sheet; sat on the Asset Liability Committee; and was responsible for the overall Treasury activities of the bank. He later headed up HSBC’s Global Treasury and Capital Markets Product training for two years in Hong Kong. Specifically, his responsibilities included developing new courses and delivering courses to traders, support staff and relationship managers. In New York, he established a training department for the firms’ Securities Division where he was in charge of the MBA Associates Program, continuing education and Section 20 license.
He has co-authored/co-edited seven books on derivatives including The Swaps Handbook and Understanding Swaps.
Publications and Articles
Articles
2019 3-Month SOFR Futures
2019 LIBOR Schmibor: What’s Next? SOFR Part I and Part II
2018 VIX, Volatilities, and Exchange Traded Products
2018 Settlement Risk and Blockchain
2017 Electronic Trading and Flash Crashes – Part I and Part II
2016 The Long and Short of IT: An Overview of XVA
2016 The Long and Short of IT: An Overview STACR and CAS
2016 The Federal Reserve Tolls: Past and Present
2016 The Perfect Storm: October 2008
2016 Interest Rate Swap Futures: An Introduction
2014 Risk Reversals
2002 Futures Magazine, Doing Your Homework on Individual Equity Futures (Co-written with Robert McDonough)
Blog
Ken also edits and writes for the GFMI Blog.
Books
1996 Como Entender Los Swaps, (co-author: John Marshall), published by CECSA (a Mexican publishing firm). This is a translated edition of our book Understanding Swaps, but with adaptations to fit the Mexican markets. (289 pages)
1993 The Swaps Market: 2nd edition, Kolb Publishing, 288 pages (co-author: John Marshall, copyright 1993). This book is directed to the graduate business student.
1993 Understanding Swaps, John Wiley & Sons, 270 pages (co-author John Marshall, copyright 1993). This book is directed to the practitioner market and is published as part of Wiley’s Finance Series.
1993 1993-94 Supplement to the Swaps Handbook, New York Institute of Finance, a Simon & Schuster Company, 494 pages, (co-authors John Marshall and Ellen Lonergan, copyright 1993). This book is directed to a practitioner audience and is a supplement to The Swaps Handbook. My role was largely that of editor.
1991 1991-92 Supplement to The Swaps Handbook, New York Institute of Finance (Simon & Schuster Professional Information Group), 300+ pages (co-author: John Marshall copyright 1992). This book is directed to a professional practitioner audience and is an annual supplement to The Swaps Handbook.
1990 The Swaps Handbook: Swaps and Related Risk Management Instruments, New York: New York Institute of Finance, a Simon & Schuster Company, 543 pages. (co-author: John Marshall). This book is directed to derivative product professionals.
1988 Understanding Swap Finance, Cincinnati: South Western publishing Company, 155 pages. (co-author John Marshall, copyright 1990). This was the first academic text published on the swaps markets.
Affiliations
International Association of Financial Engineers Board of Advisors – 1994 – 2010
Global Association of Risk Professionals
ATD National and New York Chapters
Copyright © 2021 by Global Financial Markets Institute, Inc.
23 Maytime Court
Jericho, NY 11753
+1 516 935 0923
www.GFMI.com
Download article