
Quite often, the media has pointed its fingers at electronic trading as the cause of various flash crashes. When delivering training on Electronic Trading, I often find that people are confused by the various terms and intricacies of this market. I thought it might be a good idea to give an overview of electronic trading and then look at the flash crashes to help explain the connection between them. This article is broken down into two parts: Part I is a primer to electronic trading and Part II discusses trading strategies and the three main flash crashes (May 6, 2010 in the U.S. Equity Markets; October 15, 2014 in the U.S. Treasury market; and October 6, 2016 in Sterling, which some refer to as a “Flash Event”).
Electronic Trading
Let’s define electronic trading as using a computer-based system to execute orders on behalf of buyers or sellers. In some cases, computer platforms may serve as the market uniting buyers and sellers; in other cases they may be on only one side of the trade. It may be referred to as “automated trading” or “computer-based trading.” By that definition, electronic markets have been around for years. Foreign exchange trading was executed via Reuters dealing systems dating back to the 1980s. In today’s environment, electronic trading may cover the entire lifecycle of a trade (i.e., no human hands are involved, as it can be initiated via a smart phone and taken electronically all the way through settlement and reporting).
Algorithmic Trading versus High Frequency Trading
What about Algorithmic Trading (AT), which also may be referred to as Automated Trading, and High Frequency Trading (HFT)? AT uses models to initiate transaction decisions. The decision to buy or sell follows rules such as attaining optimal size, achieving best prices, or leaving minimal impact on the market place, which is commonly called a footprint. Again, this last concept is not new as many traders executing large orders in the 1980s and 1990s would break up their trades among brokers to potentially leave a minimal footprint and not push the price away from them!
Algorithmic trading today usually relies on computer models to assess market opportunities based on a security’s price and other relevant data. Sometimes this can be as simple as mean reversion trades, while in other cases it may extend to using external economic data for a form of hedonic pricing.
HFT is generally considered a subset of AT. There is no one definition for HFT. (It is interesting to note that the Treasury paper describing the U.S. Treasury flash crash states “. . . the term high-frequency trading (HFT) firm is not used given the difficulty in drawing an effective dividing line between those firms that should be included in the category and those that should not.”1)
HFT is characterized by speed, a lot of turnover within one day, small positions at any one time, the purchase and sale or the sale and purchase of securities within seconds/milliseconds, and a flat/zero position at the end of the trading day. This contrasts to a fundamental portfolio manager who may own a stock for years. How many years has Warren Buffet owned Coca Cola? I don’t know the answer but it adds up to a lot of milliseconds, which is defined as one thousandth of a second!
Information Required
Trading systems need to be exceptionally fast as they have to receive information, make a trading decision, and execute an order. The information processed may include2:
- Trade reports and quote changes in the securities or contracts that they trade
- Similar data for instruments that are correlated with the securities that they trade
- Indexes that summarize these data across markets and for various instruments classes
- Changes in limit order books, and
- News releases from companies, governments, and other producers and aggregators of information
Types of Systems/Platforms/Networks
Since one of the goals of the article is to discuss the flash crash in three different asset classes, I thought it would be a good idea to review the types of platforms/networks that are used in the marketplace. However, terms used and the evolution of the respective markets may be different across geographical boundaries. Therefore, let’s approach it from a generic viewpoint.
Examples of networks include Alternative Trading Systems (ATS), Electronic Communication Network (ECN), and Request for Quote (RFQ).
ATS trades Over the Counter (OTC), which is different from an exchange which brings buyers and sellers together. As such, it is required to follow certain local regulations. For example, the SEC imposed Regulation ATS, which differentiated between exchanges and non-exchanges/ATS, in 1998. ATS are regulated in the U.S. as broker/dealers.
ECNs (which are a subset of ATS but not every country uses the term ATS) are electronic systems bringing buyers and sellers together. They tend to be order driven, such as a central limit order book, or CLOB (CLOB is discussed in more detail below). They are found in all three asset categories.
RFQs are platforms where an end user requests a quote and market makers will respond with a corresponding quote. The end user may request a few or many dealers to respond.
Exchange Traded versus OTC Transactions
Some financial instruments trade (are transacted) on organized exchanges such as equity or futures exchanges, while others, such as fixed income and foreign exchange, trade on OTC markets. Let’s briefly examine the differences.
Organized exchanges use a central limit order book or CLOB. Basically, a CLOB uses a matching algorithm to prioritize buy and sell orders based on price and the time the order is received. The “depth” of the book depends on the number of orders currently on the book. These orders are referred to as “resting orders.” Let’s look at the two tables below which represent two different theoretical markets. Both tables show buy orders, price, and sell orders. Both the buy and sell orders represent the number of shares associated with each price. (It does not tell us the number of different orders at each price but rather a cumulative number of shares to be bought or sold at each price.) The depth of the orders is based on the number of shares “resting” to be purchased or “resting” to be sold. Clearly, Table 1 indicates the order book has more depth than the order book in the Table 2. The first order book would also be considered more liquid, all else being equal.
| Table 1 | Table 2 | |||||
| Buy Orders | Price | Sell Orders | Buy Orders | Price | Sell Orders | |
| 100.04 | 38,000 | 101.00 | 100 | |||
| 100.03 | 25,000 | 50 | 100.00 | |||
| 100.02 | 10,000 | |||||
| 100.01 | 20,000 | |||||
| 10,000 | 100.00 | |||||
| 20,000 | 99.99 | |||||
| 30,000 | 99.98 | |||||
| 20,000 | 99.97 | |||||
| 49,000 | 99.96 | |||||
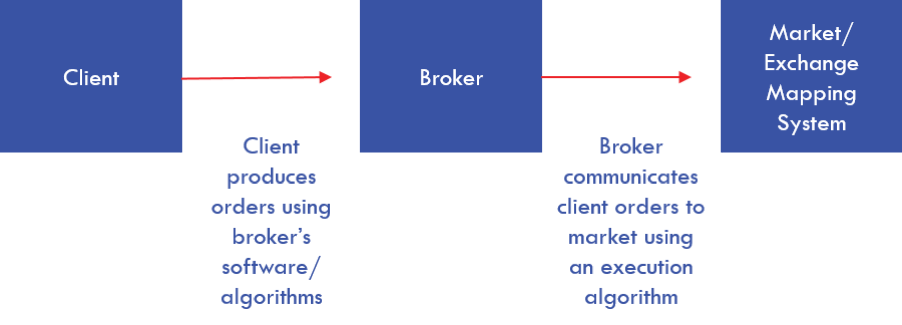
Additionally, the broker/dealer needs access to the exchange’s matching system to enter the trade. Here is an oversimplified diagram showing the initiation of the order to execution:
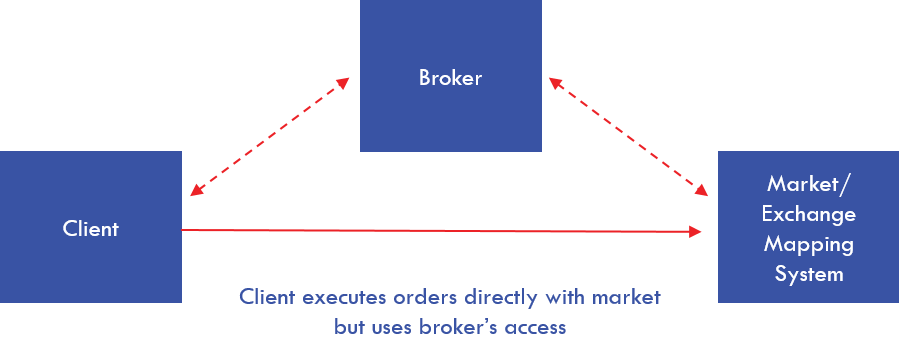
An alternative method to access the market is referred to as Direct Market Access which allows the client to execute directly with the market using the broker’s access, as illustrated below:
OTC orders are bilateral transactions where the end user, such as an insurance company, will deal directly with a dealer versus executing on an exchange. The transaction can be executed over the phone or electronically. As mentioned above, foreign exchange and fixed income fall into this category.
Interestingly, the trading of U.S. Treasuries, often considered one of the most liquid markets in the world, is dominated by a central limit order book offered by two platforms – BrokerTec and eSpeed (http://www.nasdaqomx.com/transactions/trading/treasuries). The participants on these platforms are HFT/Algo traders and traditional Treasury dealers3. In addition to the CLOB, there is a bilateral market between dealers and their customers for U.S. Treasuries.
Corporate bonds are a very different animal than U.S. Treasuries. Where U.S. Treasuries are benchmarks and considered very liquid instruments, the market for corporate notes and bonds will very much depend on the issuer. Corporations, such as GE, may have over 200 issues outstanding while others may have only a handful. Just because a company may have a lot of issues outstanding does not automatically mean their notes/bonds are liquid.
With the advent of TRACE4, participants realized that some notes/bonds might not trade for weeks! The market’s response to this has been to develop over 100 different trading platforms in the U.S. While additional platforms by themselves do not help to enhance liquidity, the realization that market heterogeneity was so significant led many financial intermediaries to look for opportunities to provide transparency to clients and hence win greater trading volume.
As you might imagine, different platforms have better liquidity in some issues while other platforms have better liquidity in other issues. The bottom line is that the market for corporate bonds has become quite fragmented. (The early adopters of electronic trading platforms have quite an advantage in that they were first on the block and end users are familiar with their systems. This includes MarketAxess® [http://www.marketaxess.com/] and Tradeweb [http://www.tradeweb.com/]).
Another interesting point: U.S. Treasuries will be required to be reported to TRACE starting in July 2017.
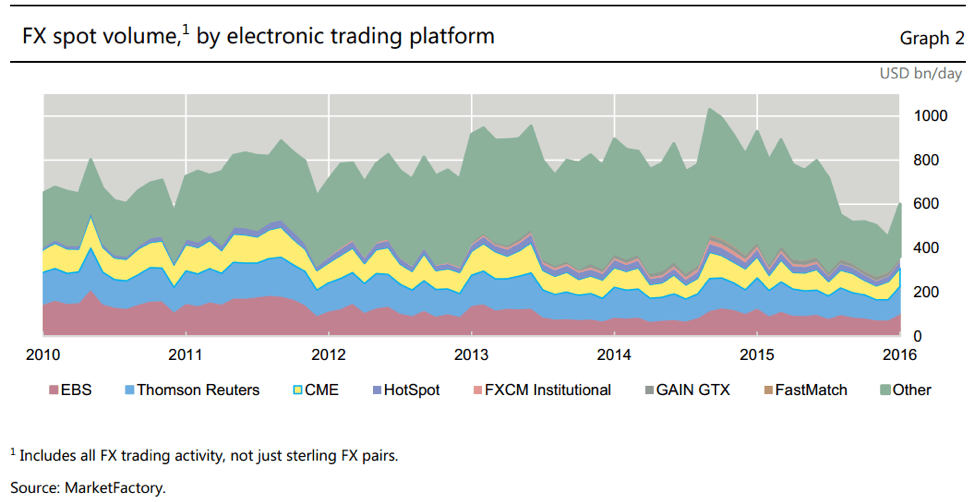
Foreign exchange is an OTC market that has a daily volume of over USD 5 trillion (http://www.bis.org/publ/rpfx16.htm?m=6%7C35). It is open 24 hours a day, 5½ days per week. Originally dominated by bank dealers and voice trading, electronic trading now dominates. However, it also has become a fragmented market. The following is a graph from the BIS report5showing the volume of spot FX across different electronic platforms indicating the fragmentation:
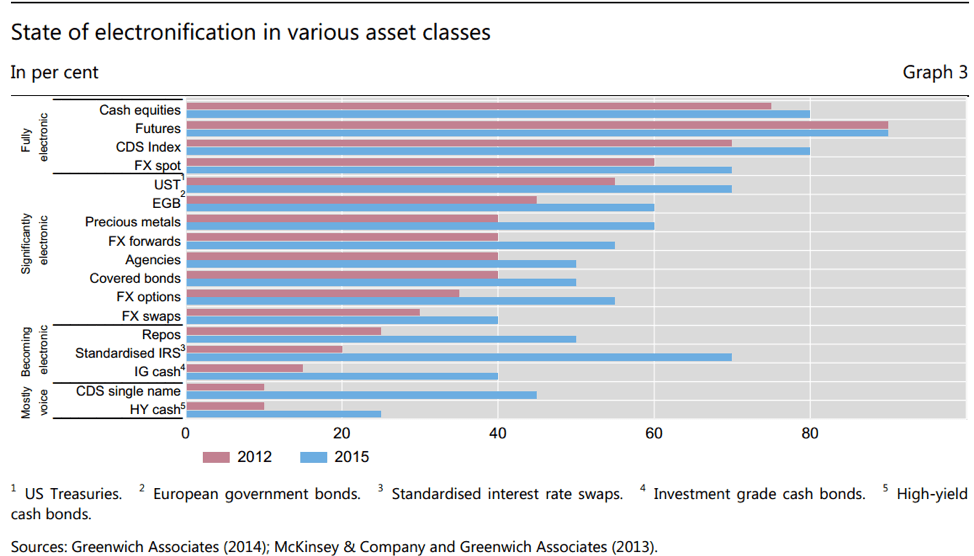
To say the least, going forward, there will be platforms that survive and others that won’t – in both the fixed income and FX electronic trading world. (The electronification of asset classes have evolved at different speeds, no pun attended. To see the state of electronification across asset classes, look at the chart in the Appendix.)
Other Considerations
Other aspects of electronic trading include colocation, latency, and what I will call the “vessel for transmission.”
Colocation, sometimes abbreviated as colo, is where the servers of the end user are physically located in relation to the matching system/servers for the exchange/CLOB. For example, assume that the servers for the NYSE are located in lower Manhattan. If your servers are in San Francisco, you would be at a distinct disadvantage versus a server located say in New Jersey, which is right across the river from lower Manhattan. No matter how fast the speed, being closer is better! As the NYSE states on their web page:
| “Our liquidity centers in the U.S. (Mahwah, New Jersey) and UK (Basildon, Essex) are among the most robust data center facilities in the world, and they enable customers to co-locate their equipment in an environment designed for capital market continuity and high security.
Colocation in Mahwah offers participants the most direct route to the NYSE Group market data and trading venues, while colocation in Basildon provides the most direct route to ICE exchanges housed at that location.” (https://www.nyse.com/connectivity/colo) |
I suspect that while streaming a movie or TV show, you have experienced latency. This is when your computer or TV freezes and then (hopefully) starts up a few seconds later. In trading, the moment the algo sends an order to execute a trade, and the lower the latency, the faster the transaction will be executed. This is obviously pretty important in a world of speed, speedier, and speediest!
The vessel for transmission also has to be very fast. Ever see one of those old pictures of Wall Street with the telephone wires overhead? The individual with the information wins first – even back then! As Tabb Forum observes: “Financial markets not only have pushed the transition from horse to carrier pigeon, telegraph, phone, fiber optics, microwave, and, now, laser – they’ve also financed it.” (http://tabbforum.com/opinions/redefining-and-reimagining-speed-in-the-capital-markets?print_preview=true&single=true).
In Part II of this article we will discuss trading strategies and the different flash crashes/events and determine the connection between them.
Appendix – State of the Electronification in Various Asset Classes6
References
1Joint Staff Report: The U.S. Treasury Market October 15, 2014, U.S. Department of the Treasury, Board of Governors of the Federal Reserve System, Federal Reserve Bank of New York, U.S. Securities and Exchange Commission and U.S. Commodity Futures Trading Commission, July 13, 2015
2Sourced from: Trading and Electronic Markets: What Investment Professional Need to Know, Larry Harris CFA, CFA Institute Research Foundation, 19 October 2015
3See footnote 1
4TRACE or Trade Reporting and Compliance Engine is the “FINRA-developed vehicle that facilitates the mandatory reporting of OTC secondary market transaction in eligible fixed income securities”. For more information go to http://www.finra.org/industry/trace
5The Sterling ‘Flash Event’ of 7 October 2016, Markets Committee, Bank For International Settlements, January 2017
6Electronic Trading in Fixed Income Markets, January 2016, Markets Committee, Bank for International Settlements
About the Author: Kenneth Kapner

Copyright © 2017 by Global Financial Markets Institute, Inc.
Download article