
In our LIBOR Schmibor article series, I introduced SOFR (See https://www.gfmi.com/articles/libor-schmibor-whats-next-sofr-part/). SOFR issuance continues to expand including the potential use in adjustable rate mortgages. (To view a user’s guide for SOFR, go to https://www.newyorkfed.org/medialibrary/Microsites/arrc/files/2019/Users_Guide_to_SOFR.pdf.) In this article, we intend to explore futures on SOFR, specifically 3-month SOFR futures (SFR) and compare this to 3-month Eurodollar (ED) futures.
Historically, 3-month Eurodollar futures (where the underlying is 3-month LIBOR), has been an extremely successful futures contract. ED are commonly used in the derivatives markets when building curves at the short end of the yield curve. Given the success of the ED contract, the Chicago Mercantile Exchange (CME) has decided to replicate, as close as possible, the contract specifications of the ED for the SFR. Here are the similarities:
- IMM dates will be used which implies the third Wednesday of a quarterly cycle: March, June, September, and December.
- Contract size = $25 per basis point. One might call this the tick value. However, the contracts’ minimum price increments will be a half of a basis point, or $12.50, as well as ¼ of a basis point or $6.25. The minimum price increment will depend on how close to maturity the contract is. Although these contracts may trade at increments below 1 basis point, the main risk metric OTC dealers use is dollar value of a basis point (DV01) or $25.
- The price of the contract equals 100.00 minus the implied rate (R). For example, if the implied rate was 1.75, then the price of the contract would equal 98.25. If the implied yield changed to 1.73, the new contract price is 98.27.
- A full index point, or 100 basis points, is worth $2,500.
Summarizing this in an example, if one purchased 10 contracts and the price moved from 98.25 to 98.27, as per above, the buyer would earn a profit of illustrated below:
| 10 contracts x 2 ticks x $25 per tick or $500 |
The differences between the ED and the SFR contracts include:
- SOFR is now the underlying versus 3-month LIBOR.
- 3-month SOFR is calculated on a compounded daily rate.
It’s no surprise that the underlying has to change since LIBOR is being dissolved. The second bullet point, however, is a major change. Where LIBOR would be set two days before the final trading day, SOFR is a daily average. The SOFR rate is published by the Federal Reserve the following day. Therefore, to achieve a final settlement rate, the full contract period must elapse to obtain the final settlement rate. In contrast, LIBOR is calculated on a single day. There is a low probability of manipulating an average over approximately 90 days versus a rate that is set at one point in time. After all, it was the LIBOR manipulation scandal that led to changing risk-free benchmarks!
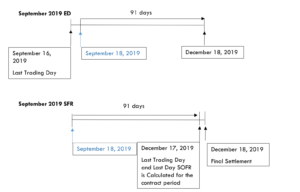
Let’s illustrate the differences that arise by using the September 2019 contracts for both the ED and SFR. The IMM dates, or the third Wednesdays, are September 18, 2019 and December 18, 2019. The first timeline shows the ED specification. The final LIBOR for settlement is determined on Monday, September 16, 2019 which represents the final trading day. This final LIBOR is determined on a single day. The contract then comes “off the board” and doesn’t trade after September 16, 2019.
SOFR is calculated using the rate starting on Wednesday September 18 (recall the actual SOFR calculation is released the following day by the Fed) through Tuesday, December 17, 2019 which is also the last trading day. Since there is a one-day lag in the calculation of SOFR, the final determination for the settlement rate must be made on Wednesday, December 18. This contract will come off the board at the close of trading on Tuesday, December 17. By attempting to keep the contracts as similar as possible, both contract period dates represent 91 days. In both cases, the start date for the calculation of interest (remember it is a derivative deriving its value from the underlying and will therefore follow the underlying instrument’s conventions in the cash markets) is the third Wednesday of the quarterly cycle, or in this case September 18, 2109.
What do the SOFR prices imply?
Assume today is July 15, 2019; what does a price of 98.00 for the September 2019 contract imply? It implies that market participants expect that from the third Wednesday of September to the third Wednesday in December, the expected average rate for SOFR will be 2.00%. Now assume it is November 1, 2019. The markets have 44 days of actual data under their belts. Therefore, the rate expectation is a bit more precise but it is still a rate expectation as there are 47 days’ worth of data still to accumulate! Market participants’ expectations for SOFR rates are built into the SOFR futures prices.
Calculation of SOFR Over the Contract Period
For ease of illustration, let’s assume that for a three-day period, not including weekends or holidays, SOFR rates are 1.00%, 1.20% and 1.40%.
The annualized rate is given by:
| ((1+ 1.00/100 x 1/360) x (1+ 1.20/100 x 1/360) x (1 + 1.40/100 x 1/360) -1) x (360/3) x 100 = 1.200039630% |
Interestingly, when a rate is over the weekend or a holiday, simple interest is calculated. For example, assume on a Friday, SOFR is 1.50%. This would cover three days of simple and not compounded interest, or (1+ 1.50/100 x 3/360) =1.000125000.
Now let’s assume there are 6 days in our contract period. The calculation would be as follows:
| ((1+ 1.00/100 x 1/360) x (1+ 1.20/100 x 1/360) x (1 + 1.40/100 x 1/360) x (1+ 1.50/100 x 3/360) -1) x (360/6) x 100 = 1.350094818 |
The final calculation then for the entire contract period will include both compounded rates and simple interest. This aligns with current standards for overnight index swaps (OIS).
The final settlement rate will be rounded to the nearest 1/100th basis point or 1.3501% for a final settlement price of 100 minus 1.3501 = 98.6499.
Summary
This article compared the three-month Eurodollar (ED) and SOFR futures contracts identifying the similarities and the differences. In addition, a theoretical example was provided for the final settlement rate. In a future article, we will explore the one-month SOFR futures contract.
References
https://www.cmegroup.com/trading/interest-rates/secured-overnight-financing-rate-futures.html
About the Author: Kenneth Kapner

He has been a Risk Management Advisor to a Mutual Fund’s Board of Trustees and has served as an Expert Witness using knowledge of derivatives, trading and risk management.
Prior to starting GFMI in 1998, Ken spent 14 years with the HSBC (Hong Kong and Shanghai Banking Corporation) Group in their Treasury and Capital markets area where he traded a variety of instruments including interest rate derivatives, spot and forward foreign exchange, money markets; managed the balance sheet; sat on the Asset Liability Committee; and was responsible for the overall Treasury activities of the bank. He later headed up HSBC’s Global Treasury and Capital Markets Product training for two years in Hong Kong. Specifically, his responsibilities included developing new courses and delivering courses to traders, support staff and relationship managers. In New York, he established a training department for the firms’ Securities Division where he was in charge of the MBA Associates Program, continuing education and Section 20 license.
He has co-authored/co-edited seven books on derivatives including The Swaps Handbook and Understanding Swaps.
Publications
Articles
“Doing Your Homework on Individual Equity Futures”; Futures Magazine, March 2002 (with Robert McDonough)
Books
1996 Como Entender Los Swaps, (co-author: John Marshall), published by CECSA (a Mexican publishing firm). This is a translated edition of our book Understanding Swaps, but with adaptations to fit the Mexican markets. (289 pages)
1993 The Swaps Market: 2nd edition, Kolb Publishing, 288 pages (co-author: John Marshall, copyright 1993). This book is directed to the graduate business student.
1993 Understanding Swaps, John Wiley & Sons, 270 pages (co-author John Marshall, copyright 1993). This book is directed to the practitioner market and is published as part of Wiley’s Finance Series.
1993 1993-94 Supplement to the Swaps Handbook, New York Institute of Finance, a Simon & Schuster Company, 494 pages, (co-authors John Marshall and Ellen Lonergan, copyright 1993). This book is directed to a practitioner audience and is a supplement to The Swaps Handbook. My role was largely that of editor.
1991 1991-92 Supplement to The Swaps Handbook, New York Institute of Finance (Simon & Schuster Professional Information Group), 300+ pages (co-author: John Marshall copyright 1992). This book is directed to a professional practitioner audience and is an annual supplement to The Swaps Handbook.
1990 The Swaps Handbook: Swaps and Related Risk Management Instruments, New York: New York Institute of Finance, a Simon & Schuster Company, 543 pages. (co-author: John Marshall). This book is directed to derivative product professionals.
1988 Understanding Swap Finance, Cincinnati: South Western publishing Company, 155 pages. (co-author John Marshall, copyright 1990). This was the first academic text published on the swaps markets.
Affiliations
International Association of Financial Engineers
Board of Advisors – 1994 – 2010
Global Association of Risk Professionals
ATD National and New York Chapters
Copyright © 2019 by Global Financial Markets Institute, Inc.
PO Box 388
Jericho, NY 11753-0388
+1 516 935 0923
www.GFMI.com
Download article