
Volatility in the stock market was subdued through 2017 as can be seen in Figure 11. Many people began to sell volatility to capture this “non-movement.” In trading parlance, it is referred to as a short vol trade. But in February of 2018, the VIX had a massive move up in volatility. From the close on February 2 to the close on February 5, the VIX was up over 100%! A nice return if you got it right but . . . many did not. In fact, one exchange traded product (ETP) ceased to exist and another changed its objectives.
This article defines the VIX, reviews option volatility, and explains a bit more about the two ETPs just mentioned.
Figure 1
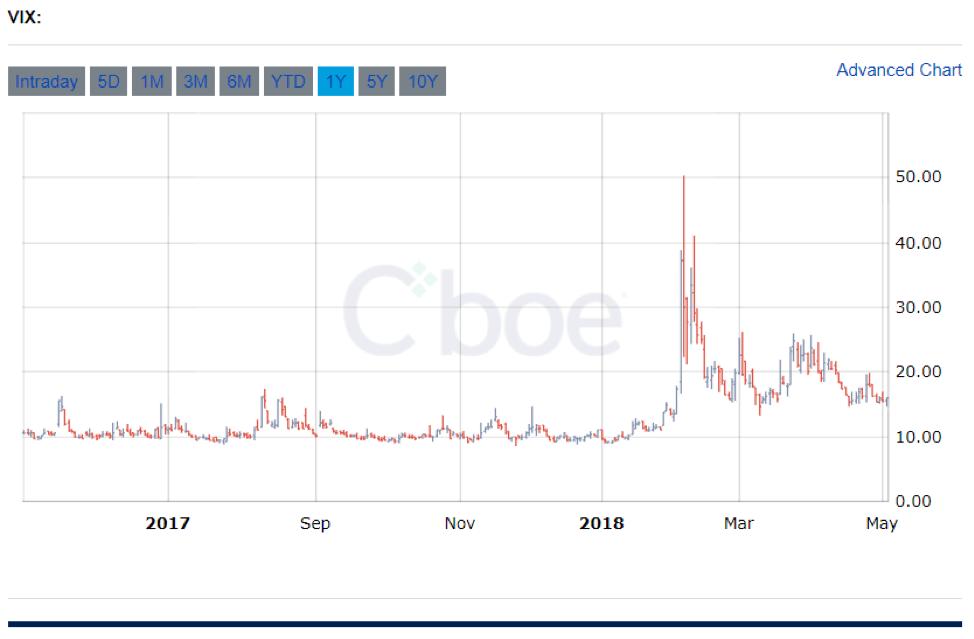
VIX
According to the CBOE website2, “The VIX is a calculation designed to produce a measure of constant, 30-day expected volatility of the U.S. stock market, derived from real-time, mid-quote prices of the S&P 500®Index (SPXSM) call and put options.” Let’s explore volatility and what is meant by expected or implied volatility.
Option Valuation
The value of an option is determined by the following variables:
- The cash price of the underlying instrument (e.g., an individual stock or an equity index),
- The strike price,
- Volatility,
- Interest rates,
- Dividends, and
- Time to maturity
Take each of these variables, use them as inputs for a model, such as the Black Scholes or binomial model, and the output will be the price of the option. Of course, whether it is a put or call, or American or European style, will also impact the price of the option. For purposes of this article we will focus on volatility.
Assume the following values for the variables cited above:
| Cash Price | 100 | Cash Price | 100 | Cash Price | 100 | ||
| Strike Price | 100 | Strike Price | 100 | Strike Price | 100 | ||
| Volatility | 10% | Volatility | 20% | Volatility | 5% | ||
| Interest Rates | 2% | Interest Rates | 2% | Interest Rates | 2% | ||
| Dividends | 2% | Dividends | 2% | Dividends | 2% | ||
| Time to Maturity | 30 days | Time to Maturity | 30 days | Time to Maturity | 30 days | ||
| The resulting price is… | $1.14 | The resulting price is… | $2.28 | The resulting price is… | $0.57 |
Notice the price disparity with the onlydifference between the three examples being that of volatility. As volatility goes up, the price of the option went up. When volatility went down, the price of the option also went down. Therefore, traders follow volatility strategies based on their forecast of volatility. If the forecast is for volatility to go up, then one would buy/go long the option. If the forecast is for volatility to go down, then one would sell/go short the option.
However, if we know the option price, which is quite often the case for exchanged traded equity options, we can rearrange the variables that we input into the model and work backwards to obtain an ‘Implied Volatility” as shown on the next page.
| Input | Input | Input | |||||
| Cash Price | 100 | Cash Price | 100 | Cash Price | 100 | ||
| Strike Price | 100 | Strike Price | 100 | Strike Price | 100 | ||
| Price of the option | $1.14 | Price of the option | $2.28 | Price of the option | $0.57 | ||
| Interest Rates | 2% | Interest Rates | 2% | Interest Rates | 2% | ||
| Dividends | 2% | Dividends | 2% | Dividends | 2% | ||
| Time to Maturity | 30 days | Time to Maturity | 30 days | Time to Maturity | 30 days | ||
| Output | Output | Output | |||||
| Volatility | 10% | Volatility | 20% | Volatility | 5% |
It should not be a surprise that the volatility output is the same as the original volatilities as we have used the same variables and the same model. The conclusion is that trading volatility strategies can potentially result in big returns assuming the forecast of volatility is accurate.
The VIX allows market practitioners to monitor volatility on the S&P 500. If you want to trade the VIX, you can use are futures contracts, options, and ETPs.
Exchange Traded Products/Funds
There are exchange traded products (ETP) that seek returns that are based on the inverse of an index. For example, if the index goes up 10%, the ETP should lose 10% and vice versa (well, at least in theory . . .). Two ETPs following this inverse strategy use(d) the VIX as their index3. They were Velocity Share Daily Inverse Short-Term ETN issued by Credit Suisse whose symbol was XIV (not a typo) and ProShares Short VIX Short-Term Futures ETF whose symbol is SVXY. If the ETP’s price moves inversely to the VIX price movement and the VIX moves down in price, then the value of the ETP goes up. If, on the other hand, the VIX goes up in value, the ETPs lose money.
Figure 2 shows the price movement of the VIX futures contract. As the graph indicates, on February 5, 2018 the VIX had a big upward move3,4.Since both ETPs are structured to move in the opposite direction of the VIX price movements, they lost a substantial amount of money: approximately 90% of the funds’ value.
Figure 2
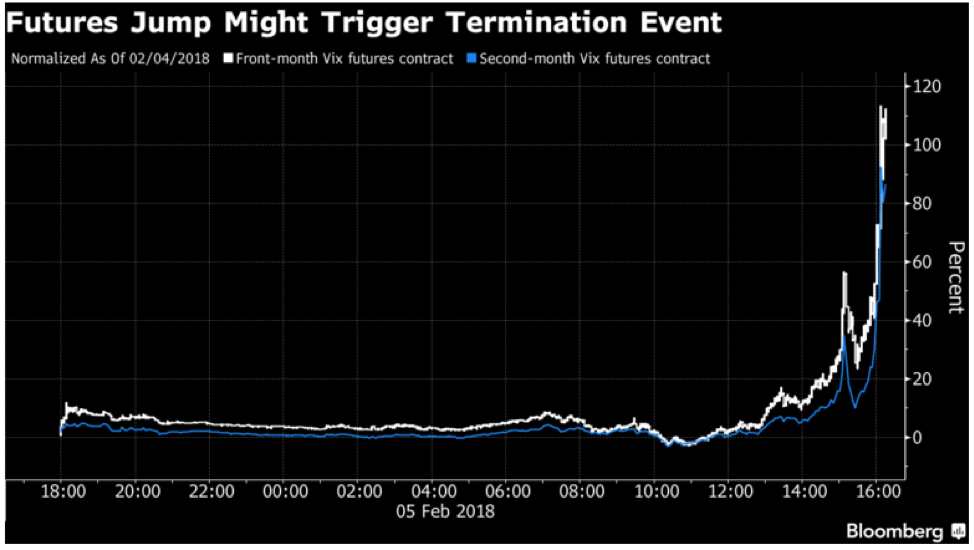
Credit Suisse called their note and Proshares ended up changing the structure of their ETF by cutting the leverage in half — from -1x to -0.5x.
Conclusion
Volatility has always been a tricky variable to trade, whether running an options book or trading a simple covered call strategy on a single financial instrument. The combination of low volatility for a sustained period of time lulled the markets. This has clearly shown the risk involved in forecasting volatility. Losing 90% of your money is never fun!
Footnotes
1This is the one-year price chart of the VIX at the close of business May 3, 2018. Source: http://www.cboe.com/products/vix-index-volatility/volatility-indexes/volatility-price-charts
2For more information on the basics of the VIX go to: http://www.cboe.com/products/vix-index-volatility/vix-options-and-futures/vix-index/vix-faqs#1or go to https://us.spindices.com/vix-intro/
3The index for both of the ETPs mentioned was the short-term futures on VIX and not the VIX itself!
About the Author: Kenneth Kapner

Copyright © 2018 by Global Financial Markets Institute, Inc.