Politicians and pundits have been casting blame and pointing fingers at a variety of sources that contributed to the collapse of Silicon Valley Bank (SVB), which also resulted in contagion at other financial institutions with similar balance sheet structures. Rather than point blame, it seems like a better idea to examine the way that SVB monitored and managed interest rate risk (IRR) and liquidity risk utilizing their internal asset liability management (ALM) processes. This article will evaluate SVB’s 2022 10-K and other sources to identify some of the key interest rate and liquidity risk drivers that led to their failure.
Background
Banks operate under specific regulations requiring senior management to assess the interest rate risks embedded in their institution’s balance sheet. Most banks charter an Asset Liability Management Committee (ALCO) to monitor and manage these risks. Larger and more complex banking organizations often form a tactical ALCO which might meet weekly and a strategic ALCO which might meet monthly. An ALCO at a smaller bank might only meet quarterly depending on the nature and degree of IRR at their institution.
The explanation of why SVB collapsed is pretty straight forward. As interest rates rose, they incurred substantial unrealized losses on their securities portfolio, which was primarily invested in relatively safe (from a credit risk perspective) U.S. Treasury securities and Agency-guaranteed residential mortgage-backed securities (RMBS). Accounting standards did not require the bank to recognize these losses in current earnings, but they did reduce the bank’s overall level of tangible equity capital. Banks are required to maintain certain levels of capital to protect against losses to depositors, but at some point, many of the bank’s customers realized the bank’s capital cushion had been substantially eroded and withdrew their deposits. Frenzied social media posts encouraging depositors to withdraw their funds appears to have exacerbated the bank’s difficulties in retaining customer balances. Ultimately this run on SVB’s deposits destroyed all confidence in the bank’s ability to manage its funding needs and the state of California closed the institution.
There were a lot of moving parts that led to SVB’s failure, many of which were readily apparent by examining the bank’s public disclosures. Let’s look at SVB’s 2022 10-K to see if it’s possible to identify disclosures that should have indicated problems related to liquidity and interest rate risk.
Interest Rate Risk
Let’s start by evaluating SVB’s market risk management framework described in the 10-K. Market risk also incorporates exposures to changes in equity values, foreign exchange rates and commodity prices, but we will focus on their interest rate risk exposures.
“Interest Rate Risk Management – Market risk is defined as the risk of adverse fluctuations in the market value of financial instruments due to changes in market interest rates. Interest rate risk is our primary market risk and can result from timing and volume differences in the repricing of our rate-sensitive assets and liabilities, widening or tightening of credit spreads, changes in the general level of market and benchmark interest rates and the shape of the yield curve. Additionally, changes in interest rates can influence the rate of principal prepayments on mortgage securities, which affects the rate of amortization of purchase premiums and discounts. Other market risks include foreign currency exchange rate risk and equity price risk (including the effect of competition on product pricing). These risks and related impacts are important market considerations but are inherently difficult to assess through simulation results. Consequently, simulations used to analyze the sensitivity of net interest income (NII) to changes in interest rates will differ from actual results due to differences in the timing and frequency of rate resets, the magnitude of changes in market rates, the impact of competition, fluctuating business conditions and the impact of strategies taken by management to mitigate these risks.”
Tools of the Trade
The main tools that banks use to measure and manage interest rate risk are net interest income (NII) forecasting and economic value of equity (EVE) modeling. Let’s look at SVB’s disclosures on interest rate risk measurement:
“Model Simulation and Sensitivity Analysis – Both EVE and NII measures rely upon the use of models to simulate cash flow behavior for loans and deposits. These models were developed internally and are based on historical balance and rate observations. As part of our ongoing governance structure, each of these models and assumptions are periodically reviewed and recalibrated as needed to ensure that they are representative of our understanding of existing behaviors. A specific application of our simulation model involves measurement of the impact of changes in market interest rates on the EVE. EVE is defined as the market value of assets, less the market value of liabilities. Another application of the simulation model measures the impact of changes in market interest rates on NII assuming a static balance sheet, in both size and composition, as of the period-end reporting date. In the NII simulation, the level of market interest rates and the size and composition of the balance sheet are held constant over the simulation horizon. Simulated cash flows during the scenario horizon are assumed to be replaced as they occur, which maintains the balance sheet at its current size and composition. Investment portfolio cash flow is based on a combination of third-party prepayment models and internally managed prepayment vectors depending on security type. Based on a historical deposit study of our clients, we make certain deposit balance decay rate assumptions on demand deposits and interest-bearing deposits, which are replenished to hold the level and mix of funding liabilities constant. These assumptions may change in future periods based on changes in client behavior and at management’s discretion.”
The highlighted statements above show that SVB did attempt to evaluate depositor behaviors over time, but it’s important to note that this historical analysis was conducted over a period when interest rate volatility was very low.
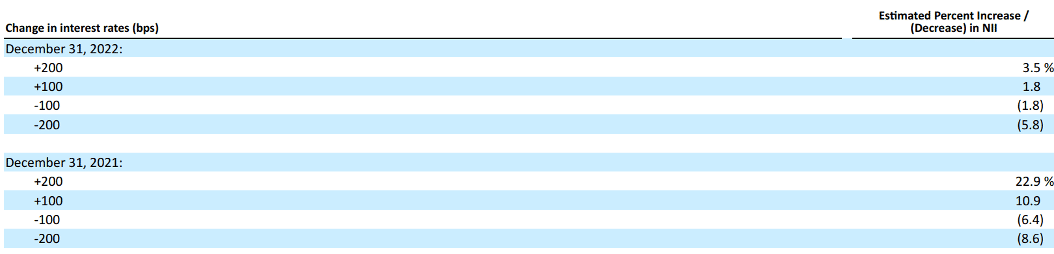
Let’s look at their NII results and explanation:
“12-Month Net Interest Income Simulation – NII sensitivity is measured as the percentage change in projected 12-month NII earned in +/-100 and +/-200 basis point interest rate shock scenarios compared to a base scenario where balances and interest rates are held constant over the forecast horizon. The reduction in our NII asset sensitivity for each parallel rate shock scenario above is primarily driven by the shift in our funding mix towards interest-bearing deposits and short-term borrowings, increase in deposit beta assumption relative to December 31, 2021, termination of our pay fixed swaps portfolio and the extension of our fixed income portfolio as a result of higher rates, partially offset by growth in variable rate loans.”
To summarize SVB’s asset/liability position at the end of 2022:
Their funding mix relied on deposits and short-term borrowings.
Deposit beta assumptions were increased (deposit betas measure the correlation of deposit rates, which are determined by management, with the actual movement in market rates).
Pay-fixed interest rate swaps used to hedge IRR in the investment portfolio were terminated.
Maturity of their bond portfolio was extended during a rising interest rate environment.
With the backdrop of increasing rates, the Fed’s persistent messaging that they would be aggressive in bringing inflation down, and the inversion of the yield curve, SVB’s decision to increase reliance on short term borrowing, terminating swap hedges and extending the maturity of the bond portfolio is baffling. History tends to repeat itself and recent developments have some of the hallmarks of the S&L crisis that unfolded in the late 1980s and early 1990s.
Liquidity Risk Management
Liquidity risk management is the ability to raise money at a reasonable price at any time. Banks are required by regulation to have formal policies to monitor and manage liquidity risk, and SVB’s 10-K describes some of their processes. However, unlike interest rate risk where you can quantify the amount of risk and see the results when interest rates move, no amount of liquidity planning can predict what will happen during a crisis. The plan may or may not work. The latter being the case with SVB. Nevertheless, it’s better to have a plan ready when in the midst of a brewing crisis.
Let’s review the sources of funds banks can utilize and then look at SVB’s funding mix. Banks can raise funds from a variety of sources:
Non-maturity deposits such as checking, savings or money market accounts. Checking accounts, or demand deposits, allows the customer to withdraw their money without any advance notice and may or may not pay interest. Savings accounts generally pay higher rates of interest than demand deposits but place limits on the frequency of withdrawals. Money market accounts generally pay even higher rates than savings accounts and permit limited withdrawals but usually require minimum balances to be maintained.
Time deposits, also called certificates of deposit (or CDs), have a contractual maturity date. Customers incur a penalty (usually forsaking any earned interest) if these deposits are withdrawn prior to maturity.
Wholesale funding sources:
Brokered deposits – out-of-market deposits obtained from brokers
Borrowings that require pledging collateral to obtain funding:
FHLB Advances
Repurchase agreements
Public deposits
Federal Reserve discount window
Interbank borrowing such as the Fed Funds market, which typically does not require collateral unless one counterparty is credit-impaired
Internet deposits/listing services
Jumbo CDs – time deposits in excess of the $250K deposit insurance threshold
Reciprocal deposit programs such as CDARS
Short term debt financing – issuing commercial paper (or CP) in the capital markets
Longer term debt financing – issuing notes or bonds in the capital markets
Equity financing – issuing common or preferred stock in the capital markets
Before we look at their funding mix, let’s look at some of SVB’s disclosures on liquidity in their 2022 10-K:
“Liquidity – The objective of liquidity management is to ensure that funds are available in a timely manner to meet our financial obligations, including, the availability of funds for both anticipated and unanticipated funding uses as necessary, paying creditors, meeting depositors’ needs, accommodating loan demand and growth, funding investments, repurchasing securities and other operating or capital needs, without incurring undue cost or risk, or causing a disruption to normal operating conditions. We regularly assess the amount and likelihood of projected funding requirements through a range of business-as-usual and potential stress scenarios based on a review of factors such as historical deposit volatility and funding patterns, present and forecasted market and economic conditions, individual client funding needs and existing and planned business activities . . .
. . . We maintain a liquidity risk management and monitoring process designed to ensure appropriate liquidity to meet expected and contingent funding needs under both normal and stress environments, subject to the regular supervisory review process. Our liquidity requirements can also be met through the use of our portfolio of liquid assets. Our definition of liquid assets includes cash and cash equivalents in excess of the minimum levels necessary to carry out normal business operations, short-term investment securities maturing within one year, AFS and HTM1 securities eligible and available for financing or pledging purposes with a maturity in excess of one year and anticipated near-term cash flows from investments.”
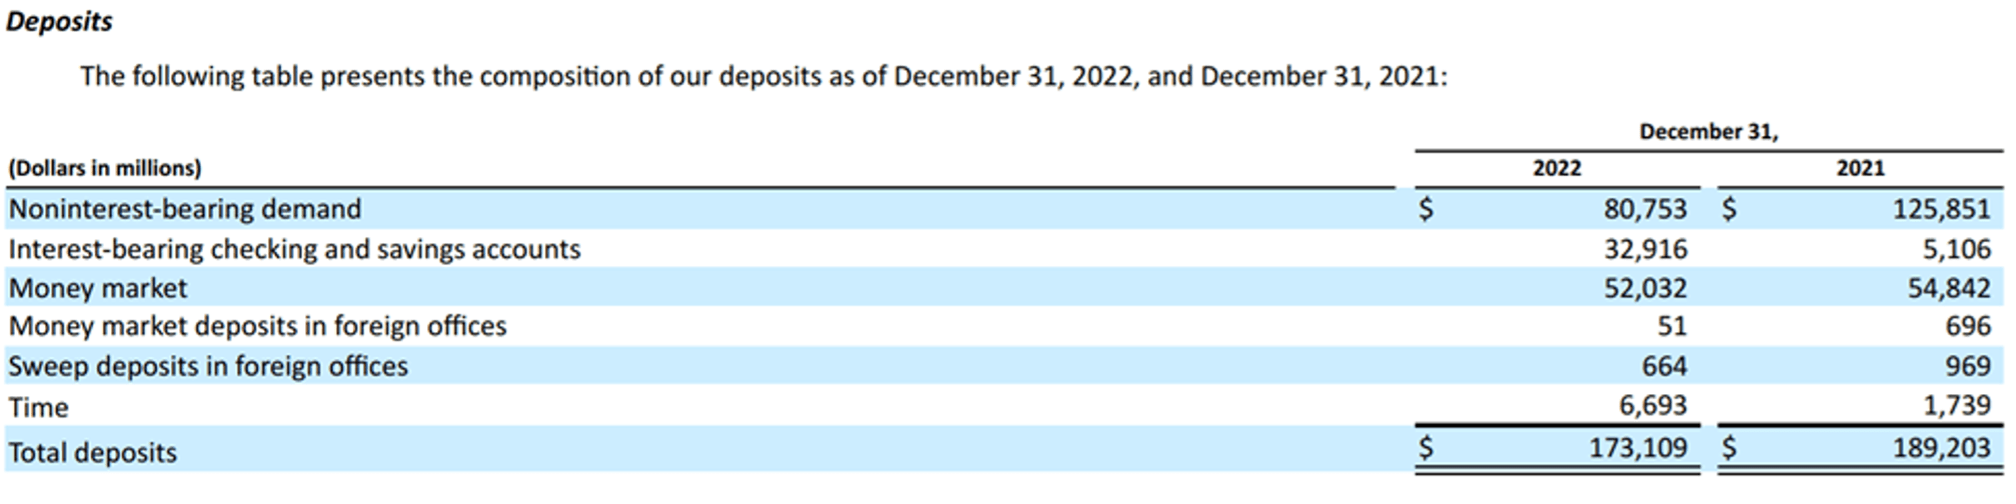
Now let’s take a look at SVB’s liabilities and funding mix, with a few clarifications:
The dollar amounts are in millions.
SVBs balance sheet size was $211.8 billion.
We have only focused on the deposits since that is at the heart of the problem and we believe the following quick analysis will support this contention.
The 10K states they can use their “… AFS and HTM securities eligible and available for financing or pledging purposes with a maturity in excess of one year…” for liquid assets. SVB did sell their AFS securities to raise cash which led to the announcement of their portfolio loss. Clearly this is another source of liquidity but the realized losses drew attention to the large unrealized losses still embedded in the portfolio.
Recall the concept of NMD. If the customer has the right to withdraw these funds, are they considered to be a stable funding source? Terms like sticky or core deposits are often used to describe these funds. Banks conduct statistical studies to estimate how stable/sticky/core these funds over long-term rate cycles. These studies indicated that SVB deposits were sticky in the long term, but did not address depositor behaviors in the short term when faced with a rapid deterioration in the bank’s financial condition.
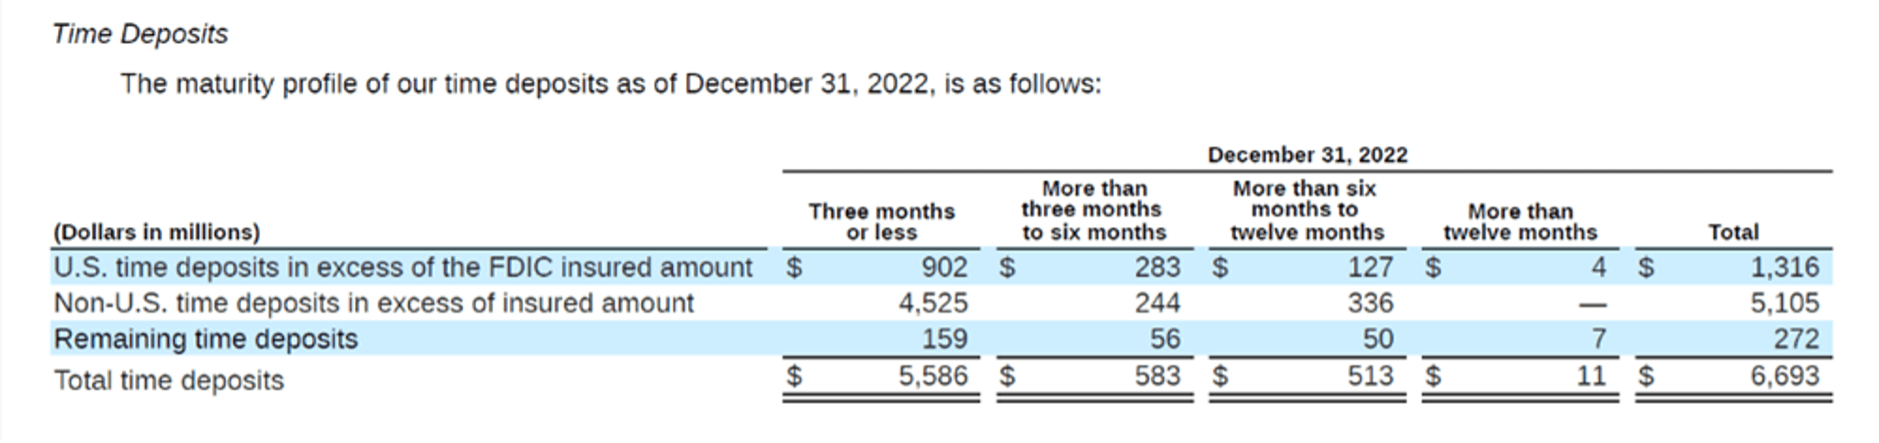
The interest-bearing deposits may have a contractual maturity but when a bank is perceived as failing then customers will still demand their money and are willing to pay any contractual breakage penalty for the return of their principal. In addition, a disclosure in the 10-K showed that a substantial portion of time deposit balances were uninsured, making them even less sticky:
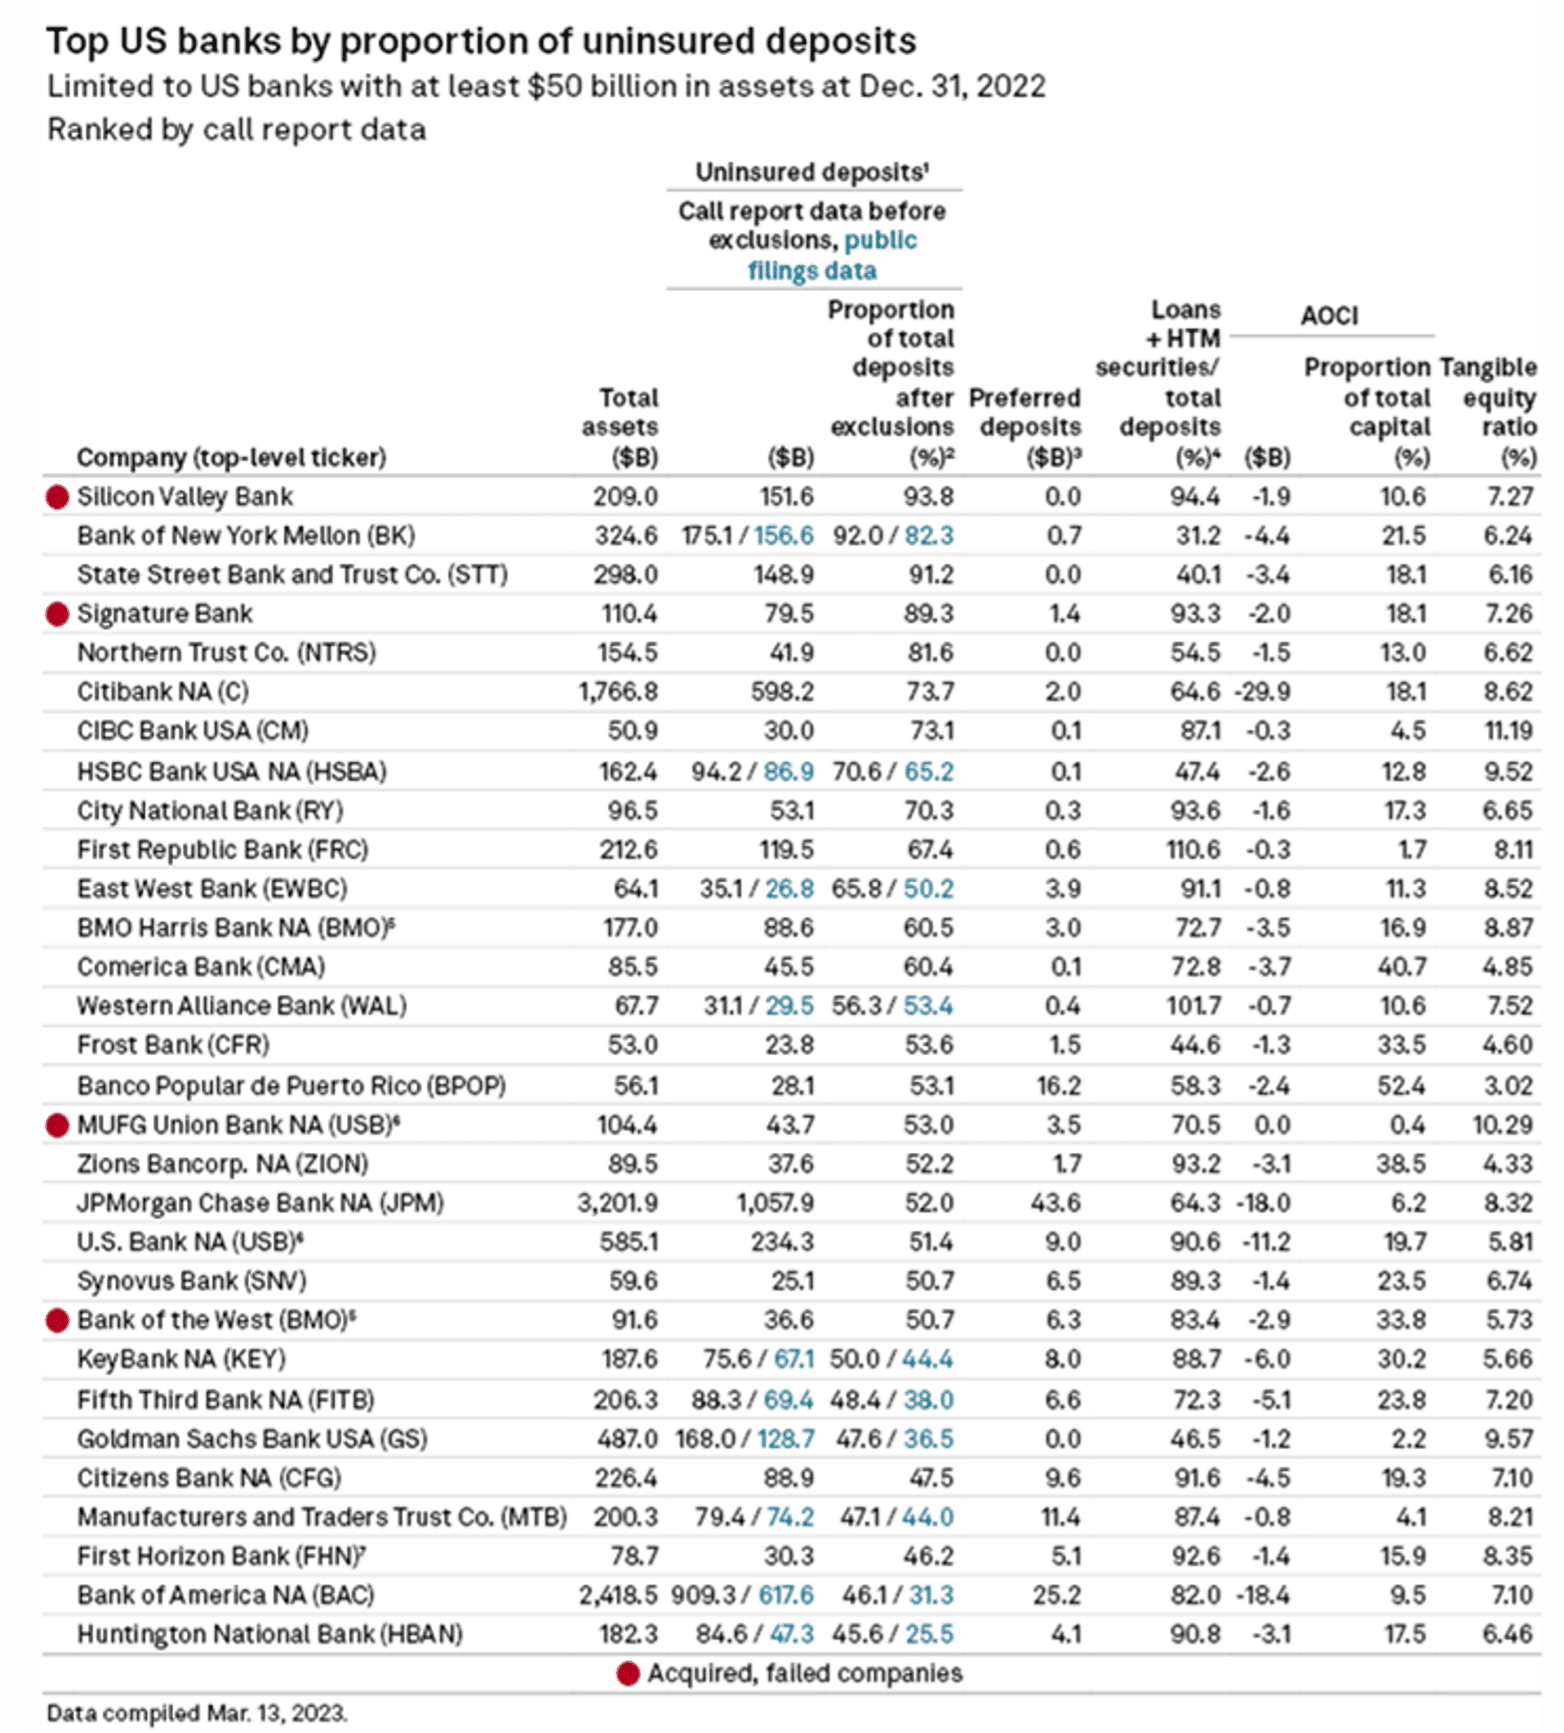
In fact, overall there was an extraordinarily high level of uninsured deposits at SVB. The table below illustrates how reliant the bank was on these types of balances, which are notoriously prone to running out of a bank at the first sign of trouble2:
SVB’s 10-K provided this statement on overall levels of uninsured deposits as of year-end 2022:
“Uninsured Deposits in U.S. Offices – As of December 31, 2022, and December 31, 2021, the amount of estimated uninsured deposits in U.S. offices that exceed the FDIC insurance limit were $151.5 billion and $166.0 billion, respectively. As of December 31, 2022, and December 31, 2021, foreign deposits of $13.9billion and $16.1 billion, respectively, were not subject to any U.S. federal or state deposit insurance regime. The amounts disclosed above are derived using the same methodologies and assumptions used for regulatory reporting requirements.”
Looking at how SVB analyzed and determined how stable these funds were will likely be a key component of any post-failure forensic report.
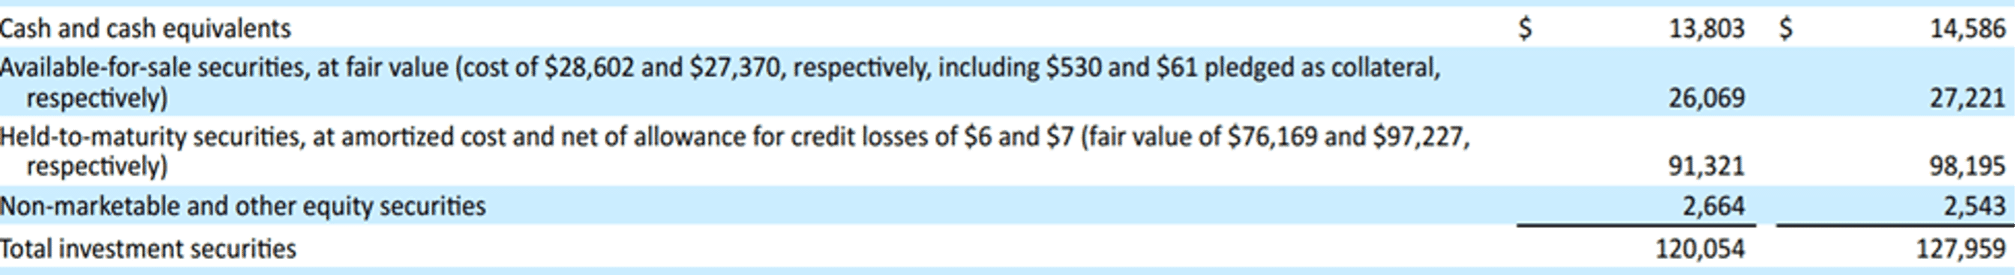
Now let’s look at the positions held in the investment portfolio:
It doesn’t take much imagination here to see what happened. The investment portfolio was $106 billion (the cash line item is removed) at year end 2022. Customers started demanding their money when word got out about the supposed demise of SVB. As can be clearly seen, the total deposits on hand at year-end 2022 were far greater than the size of the investment portfolio. Assuming the entire amount of deposits were withdrawn all at once (an admittedly extreme assumption), SVB would have been underfunded by almost $160 billion.
This obviously raises a lot of questions. With an approximately $106 billion investment portfolio made up of securities, why wasn’t this collateral mobilized to borrow in the repo market, the FHLB or from the Fed? Since they had a liquidity policy in place, which presumably included a liquidity contingency plan (LCP) in case of funding emergencies, were the proper steps taken to execute the plan? What were the early warning indicators and triggers in the LCP? What assumptions supported management’s strategy to extend the maturity of the investment portfolio, cancelling hedges and relying on short term funding in a rising rate environment?
Conclusion
This analysis has attempted to provide a measured view of the unique factors at SVB that unfolded over the past few months as opposed to what is being portrayed by politicians and the media. The 2022 10-K contains a great deal more information than has been evaluated here, but the point was to highlight the key risk drivers associated with interest rate and liquidity risk. It seems to be pretty straight forward – SVB did not fully understand the impact of unrealized losses in their investment portfolio, and uninsured depositors lost faith in the bank and pulled their money out. The Fed plans to release an assessment report by May 2023 that will most likely address other issues that are not covered here such as capital adequacy, liquidity stress testing, and the scope of regulations for mid-sized banks. While credit risk does not seem to be a major factor at this point, many of SVB’s customers were start-up tech ventures with unique credit needs, and without a bank like SVB to underwrite their borrowing needs it is unclear how they will continue to fund their operations and service existing debt, potentially leading to higher rates of delinquencies and defaults. It would be a fairly certain bet that the Fed’s report will be a lot longer than these nine pages!
References
1 AFS stands for Available-for-Sale and HTM stands for Held-to-Maturity. These are accounting terms and banks have to classify individual securities as AFS or HTM. The following is from the SEC’s website: “HTM securities, which management has the intent and ability to hold until maturity, are carried at amortized cost. AFS securities are carried at fair value and unrealized gains and losses are reported as net increases or decreases to accumulated other comprehensive income (AOCI).”
The Federal Reserve passed reforms to bank capital and liquidity rules in October 2019 that allowed banks with assets under $250 billion to opt out of including Accumulated Other Comprehensive Income (AOCI) from regulatory capital – an option that SVB exercised for their financial reporting.
Ken Kapner, CEO and President, started Global Financial Markets Institute, Inc. (GFMI) a NASBA certified financial learning and consulting boutique, in 1998. For over three decades, Ken has designed, developed and delivered custom instructor led training courses for a variety of clients including most Federal Government Regulators, Asset Managers, Banks, and Insurance Companies as well as a variety of support functions for these clients. Ken is well-versed in most aspects of the Capital Markets. His specific areas of expertise include derivative products, risk management, foreign exchange, fixed income, structured finance, and portfolio management. He has been a Risk Management Advisor to a Mutual Fund’s Board of Trustees and has served as an Expert Witness using knowledge of derivatives, trading and risk management.
Prior to starting GFMI in 1998, Ken spent 14 years with the HSBC (Hong Kong and Shanghai Banking Corporation) Group in their Treasury and Capital markets area where he traded a variety of instruments including interest rate derivatives, spot and forward foreign exchange, money markets; managed the balance sheet; sat on the Asset Liability Committee; and was responsible for the overall Treasury activities of the bank. He later headed up HSBC’s Global Treasury and Capital Markets Product training for two years in Hong Kong. Specifically, his responsibilities included developing new courses and delivering courses to traders, support staff and relationship managers. In New York, he established a training department for the firms’ Securities Division where he was in charge of the MBA Associates Program, continuing education and Section 20 license.
He has co-authored/co-edited seven books on derivatives including The Swaps Handbook and Understanding Swaps.
About the Author: Rob McDonough
Rob McDonough is the Director of ESG and Regulatory Initiatives at Angel Oak Capital Advisors, LLC and leads the ESG integration process across the firm’s investment strategies and corporate initiatives. He manages several company-wide projects including the firm’s commitments under the Net Zero Asset Managers Initiative and the UN’s Principles for Responsible Investment. He also coordinates a variety of research and publication activities with a focus on developments in the regulatory environment for financial institutions of all types. Rob is a founding member of Angel Oak’s Diversity, Equity and Inclusion (DEI) Committee and the Community Relations Committee.
He previously led Angel Oak’s financial institution consulting practice, where he managed client engagements which included risk model validations, strategic and regulatory stress testing implementations, and investment portfolio risk and performance assessments. Rob was Angel Oak’s Chief Risk Officer from 2012-2014 and initiated the organization’s enterprise-wide risk management framework and SEC compliance program. He also served in the Federal Reserve System for 12 years, first as an Economic Analyst in the Research Division and later as a Capital Markets Examiner in Supervision and Regulation.
Rob is a charter member of the United Nations Principles for Responsible Investing (PRI) Structured Products Advisory Committee, the Structured Finance Association’s ESG Task Force Steering Committee, and chairs the Fixed Income Investor Network’s (FIIN) ESG Task Force.
Rob earned an MBA with a dual major in Finance and Economics from Georgia State University and a BBA from Emory University.