
Part I of this article discussed electronic trading, the differences between algorithmic trading (AT) and high frequency trading (HFT), types of systems/platforms, exchange traded versus OTC transactions, and other considerations such as colocation. In Part II, we will address different strategies and the three main flash crashes/events.
Automated Strategies
Strategies are generally broken down into three different categories: i) trade execution, ii) market-making, and iii) market views, including directional, arbitrage, and relative value.
Trade Execution
As mentioned in Part 1, large trades are often broken down into smaller trades, so as not to leave a footprint and to obtain the best price for the transaction. These types of trades may be transacted via an execution algorithm. Generally, an execution algorithm can be defined in terms of price, time, or volume – or a combination of the three. A common execution algorithm is called Volume-Weighted Average Price, abbreviated as VWAP and pronounced “V-WAP.” This algorithm takes the average price over a set period of time, say 30 minutes, and executes a predetermined amount of contracts/securities. A Time-Weighted Average Price or “T-WAP” would be executed over a set amount of time, such as from 11 a.m. to 2 p.m., along with a given number of securities/contracts. Broker dealers or end users, such as asset managers, use automated executions to both establish and exit positions.
Market Making
Traditionally a market maker or dealer facilitates transactions by making a two-way price, i.e., a price where the market maker/dealer will buy the security and a price where the market maker/dealer will sell the security. The difference between the two prices is known as a bid-ask or bid-offer spread. The main objective is to execute these transactions throughout the day and capture the difference between in the bid-ask spread to earn a profit. Doing these enough times throughout the day can result in a tidy profit at the end of the day. However, HFT have taken on the roles of market makers (they are not called dealers in the traditional sense). They also try to earn the bid-ask spread, by using algorithms, throughout the day. Even so, they try not to take on too much inventory. If inventory (implying a large long or short position in the underlying security/instrument) becomes too large and simultaneously a big move in price occurs in the underlying security/instrument, it could result in a loss assuming the price movement is in the opposite direction of the position. This could easily wipe out the day’s profit plus some! Therefore, the HFT market maker needs to protect against the risk of building too large of an inventory. In contrast, dealers would traditionally take on inventories.
Market Views
Algorithms are written for directional bets, structural transactions, relative value plays and arbitrage opportunities. The main aim is to identify a flow in direction (for directional bets) and mispriced securities for the other types of strategies. For example, an arbitrage might be identified between a futures contract and a corresponding ETF.
The Flash Crashes
The three main flash crashes, to date, are as follows:
- In the U.S. equity markets on May 6, 2010;
- In the U.S. Treasury market on October 15, 2014; and,
- In foreign exchange markets, specifically sterling, on October 6, 2016, which some refer to as a “Flash Event”
This is not to say there aren’t other flash crashes, as there certainly have been, but those mentioned above are the main ones on which the markets and the press have focused.
What all three have in common is that the price deviated significantly from some starting price and then in a very short time period (minutes) found its way back to that same, or closer to, starting price. The following tables shows the price action of the respective movements:
Table 1:
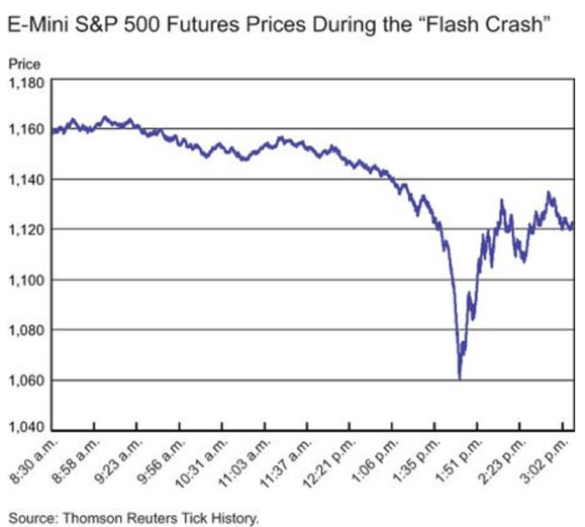
Source: The Flash Crash, Two Year On – Liberty Economics
Table 2:
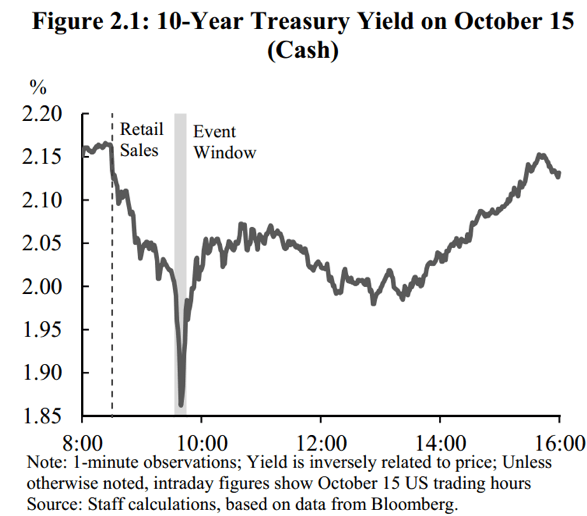
Source: Joint Staff Report: The U.S. Treasury Market October 15, 2014, U.S. Department of the Treasury, Board of Governors of the Federal Reserve System, Federal Reserve Bank of New York, U.S. Securities and Exchange Commission and U.S. Commodity Futures Trading Commission, July 13, 2015
Table 3:
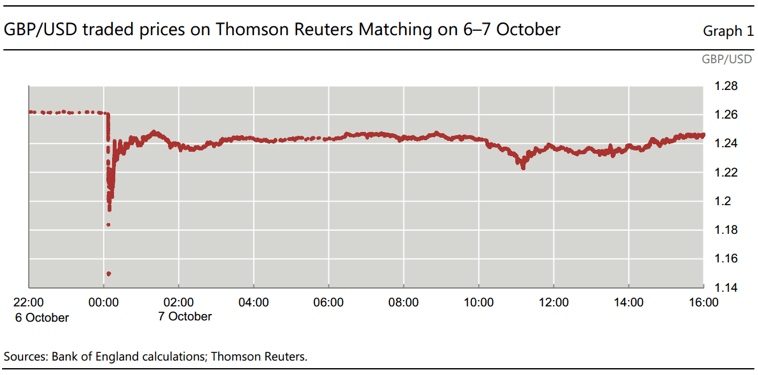
Source: The Sterling ‘Flash Event’ of 7 October 2016, Markets Committee, Bank For International Settlements, January 2017
In each case, there is a pronounced V-shape, i.e., a drop in price/yield and a subsequent return to its starting point in a matter of minutes. It is interesting to note that the U.S. Treasury graph is depicted in yield and not price. If it was shown in price, the “v” would be upside down as price is inversely related to yield. In fact, it is sometimes referred to as the flash rally!
Equity Flash Crash
Here is some background in regards to the state of the global economy and the markets for May 6, 20101:
- European debt crisis was in full swing
- Greek CDS spreads had widened
- Euro was depreciating against the USD and yen
- By mid-day the VIX had increased by 22.5% from the day’s opening
- 10-year Treasuries benefited from a flight to quality
- Liquidity dried up in S&P 500 e-mini futures, SPY and some individual stocks
To say the least, markets were skittish! What do market participants do when there is so much uncertainty? They head to the sidelines! Market makers will widen their bid-offer spreads or quote on much smaller amounts. They also get aggressive with any inventory they may have by selling it out instantaneously. The icing on the cake was when an asset manager in a mutual fund initiated a $4.1 billion/75,000 contracts sell algorithm in e-mini futures to hedge current positions.
A lack of liquidity and the large sell offer combined with lightning fast execution resulted in falling prices. As economics teaches us, when there is too much supply, the price will fall and when there is not enough supply, the price will increase.
U.S. Treasury Flash Crash
Here is some background in regards to the state of the global economy and the markets for October 15, 20142:
- In the Eurozone, there were risks to both growth and deflation
- Market participants were unsure how the European central bank would react to these risks
- Minutes from the September FOMC pointed to weaker economic growth in the US
- These among some other factors caused investors to turn to the same flight to quality as in the equity flash crash
- Many proprietary traders, including those that were leveraged, were positioned for interest rates to move up
- That morning retail sales, less autos, was 0.4% weaker than expected. (It is highly unlikely that one economic variable would cause the flash crash but given the sentiment was turning negative on the economy, it could be perceived as the straw that broke the camel’s back.)
- In the hour after the release of retails sales, volume on futures exchanges and electronic platforms surged, but dollar amounts in the Central Limit Order Book (CLOB) fell
- Market depth was extremely low, if not at its lowest point, during the event window
Similar to the equity flash crash, it appears speed of execution and lack of liquidity played a major role in the Treasury flash crash. One may also consider the possibility that directional algorithms identified the opportunity for both the initial downward move and then the retracement back.
Sterling Flash Event3
To understand the sterling flash event, one should understand liquidity. The sterling foreign exchange market exhibits the most liquidity during London trading hours. Outside of this time frame, liquidity is significantly lower. This has been true for years even prior to automated trading. (As a FX trader, we used to severely restrict sterling trading on Friday afternoons as it was extremely difficult to find a counterparty to lay off the risk going into a weekend.) The sterling flash event occurred right after British midnight or during the early trading hours in the Asian markets, which is clearly outside of the time zone when there is the most liquidity.
Other contributing factors were options hedging, execution of stop loss orders, and futures exchange rules that kicked in – halting trading and causing other venues to stop trading – as there was no indication of “where the market was trading.” In addition, it seems there were less experienced sterling traders running the show, which would indicate they had lower trading limits and experience in dealing with algos under such conditions.
Conclusion
The world of capital markets has changed. Technology has allowed for algorithms to be implemented and transactions executed where time is measured in nano- and milliseconds. Einstein would be impressed. Central limit order books are becoming more of the norm, which is fertile ground for the algos. This is compared to the more traditional over-the-counter transactions that were commonly found in U.S. Treasuries and foreign exchange. Or, maybe more succinctly, the market structure has changed. Proprietary or Principal Trading Firms have taken on the role of market makers.
It seems that these flash crashes/events all share similar characteristics: lack of liquidity, CLOBs, non-traditional market makers, and automated trading. Look for it to happen again.
There does not appear to have been any fat fingers involved and that is a shame, as it would have been a lot easier to explain!
References
1Findings Regarding the Market Events of May 6, 2010 – Report of the Staffs of the CFTC and SEC to the Joint Advisory Committee on Emerging Regulatory Issues, September 30, 2010
2Source: Joint Staff Report: The U.S. Treasury Market October 15, 2014, U.S. Department of the Treasury, Board of Governors of the Federal Reserve System, Federal Reserve Bank of New York, U.S. Securities and Exchange Commission and U.S. Commodity Futures Trading Commission, July 13, 2015
3The Sterling ‘Flash Event’ of 7 October 2016, Markets Committee, Bank For International Settlements, January 2017
About the Author: Kenneth Kapner

He has been a Risk Management Advisor to a Mutual Fund’s Board of Trustees and has served as an Expert Witness using knowledge of derivatives, trading and risk management.
Prior to starting GFMI in 1998, Ken spent 14 years with the HSBC (Hong Kong and Shanghai Banking Corporation) Group in their Treasury and Capital markets area where he traded a variety of instruments including interest rate derivatives, spot and forward foreign exchange, money markets; managed the balance sheet; sat on the Asset Liability Committee; and was responsible for the overall Treasury activities of the bank. He later headed up HSBC’s Global Treasury and Capital Markets Product training for two years in Hong Kong. Specifically, his responsibilities included developing new courses and delivering courses to traders, support staff and relationship managers. In New York, he established a training department for the firms’ Securities Division where he was in charge of the MBA Associates Program, continuing education and Section 20 license.
He has co-authored/co-edited seven books on derivatives including The Swaps Handbook and Understanding Swaps.
Copyright © 2017 by Global Financial Markets Institute, Inc.
Download article