Commercial mortgage-backed securities (CMBS) have been one of the most successful sub-classes in the structured finance clade of the fixed-income genus. This article reviews the performance of the asset class, focusing on the nexus of CMBS collateral with specific aspects of the real economy and financial markets. The goal is twofold. First, to draw some reasonable conclusions regarding the outlook for the asset class in general as well as potential divergences in performance related to the composition of the collateral pool or seniority in the capital structure. Second, how asset class and security-specific outcomes may vary, depending on which among the possible economic futures is the path history follows.
Is the Past Prologue?
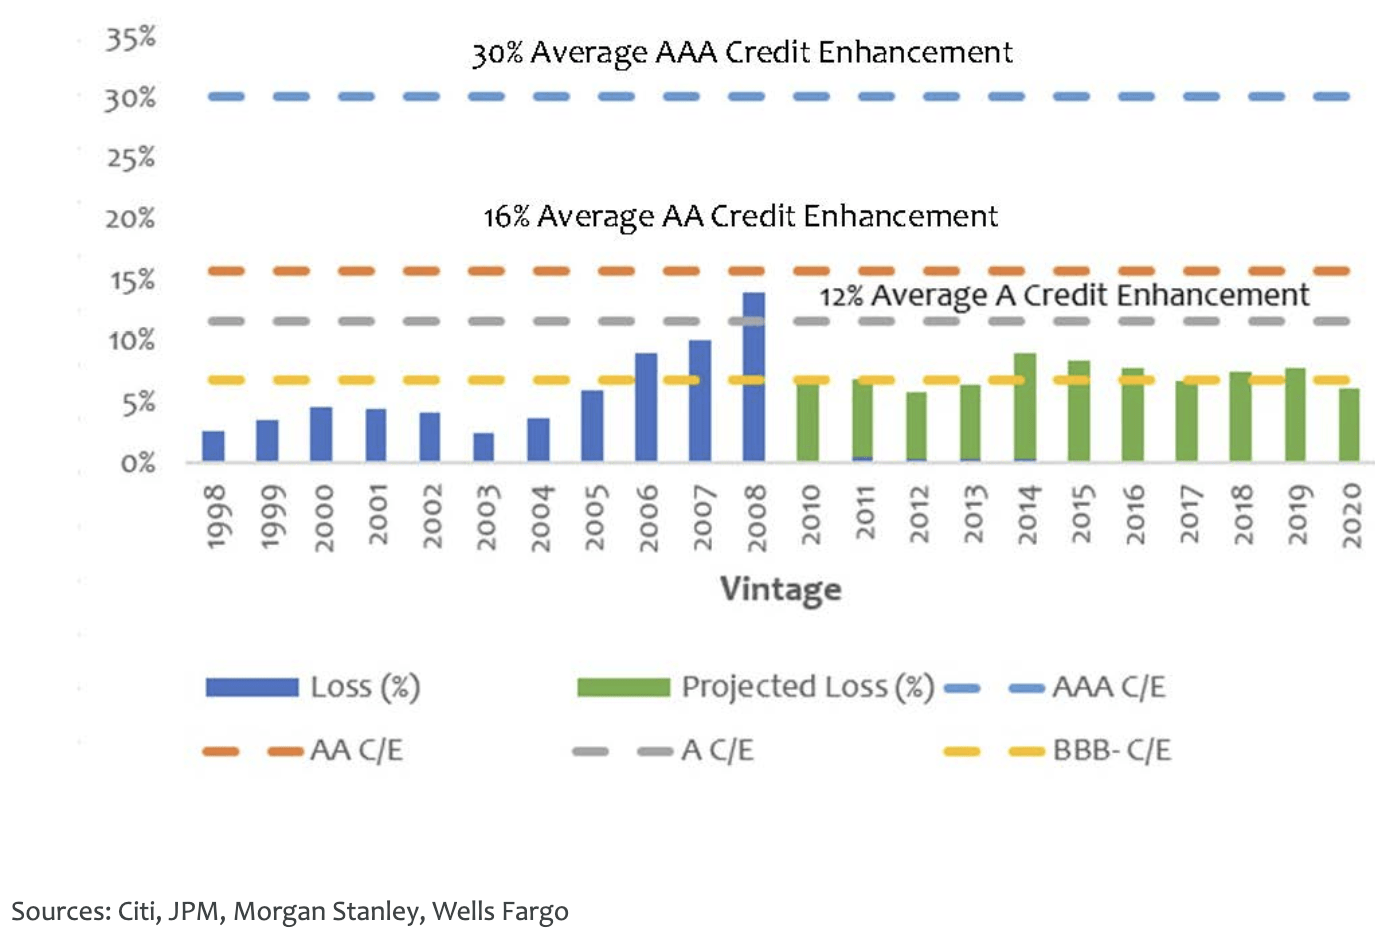
The senior-most tranches of CMBS deals have generally delivered the promised cash flows without loss of principal. That is readily apparent from a cursory glance at Exhibit 1, which shows cumulative credit losses by vintage (i.e., year of issuance), both actual (through 2008) and projected (2009-2020). CMBS principal losses have been well below the typical threshold of average credit enhancement (primarily principal of less senior tranches, called degree of subordination going forward).
Exhibit 1
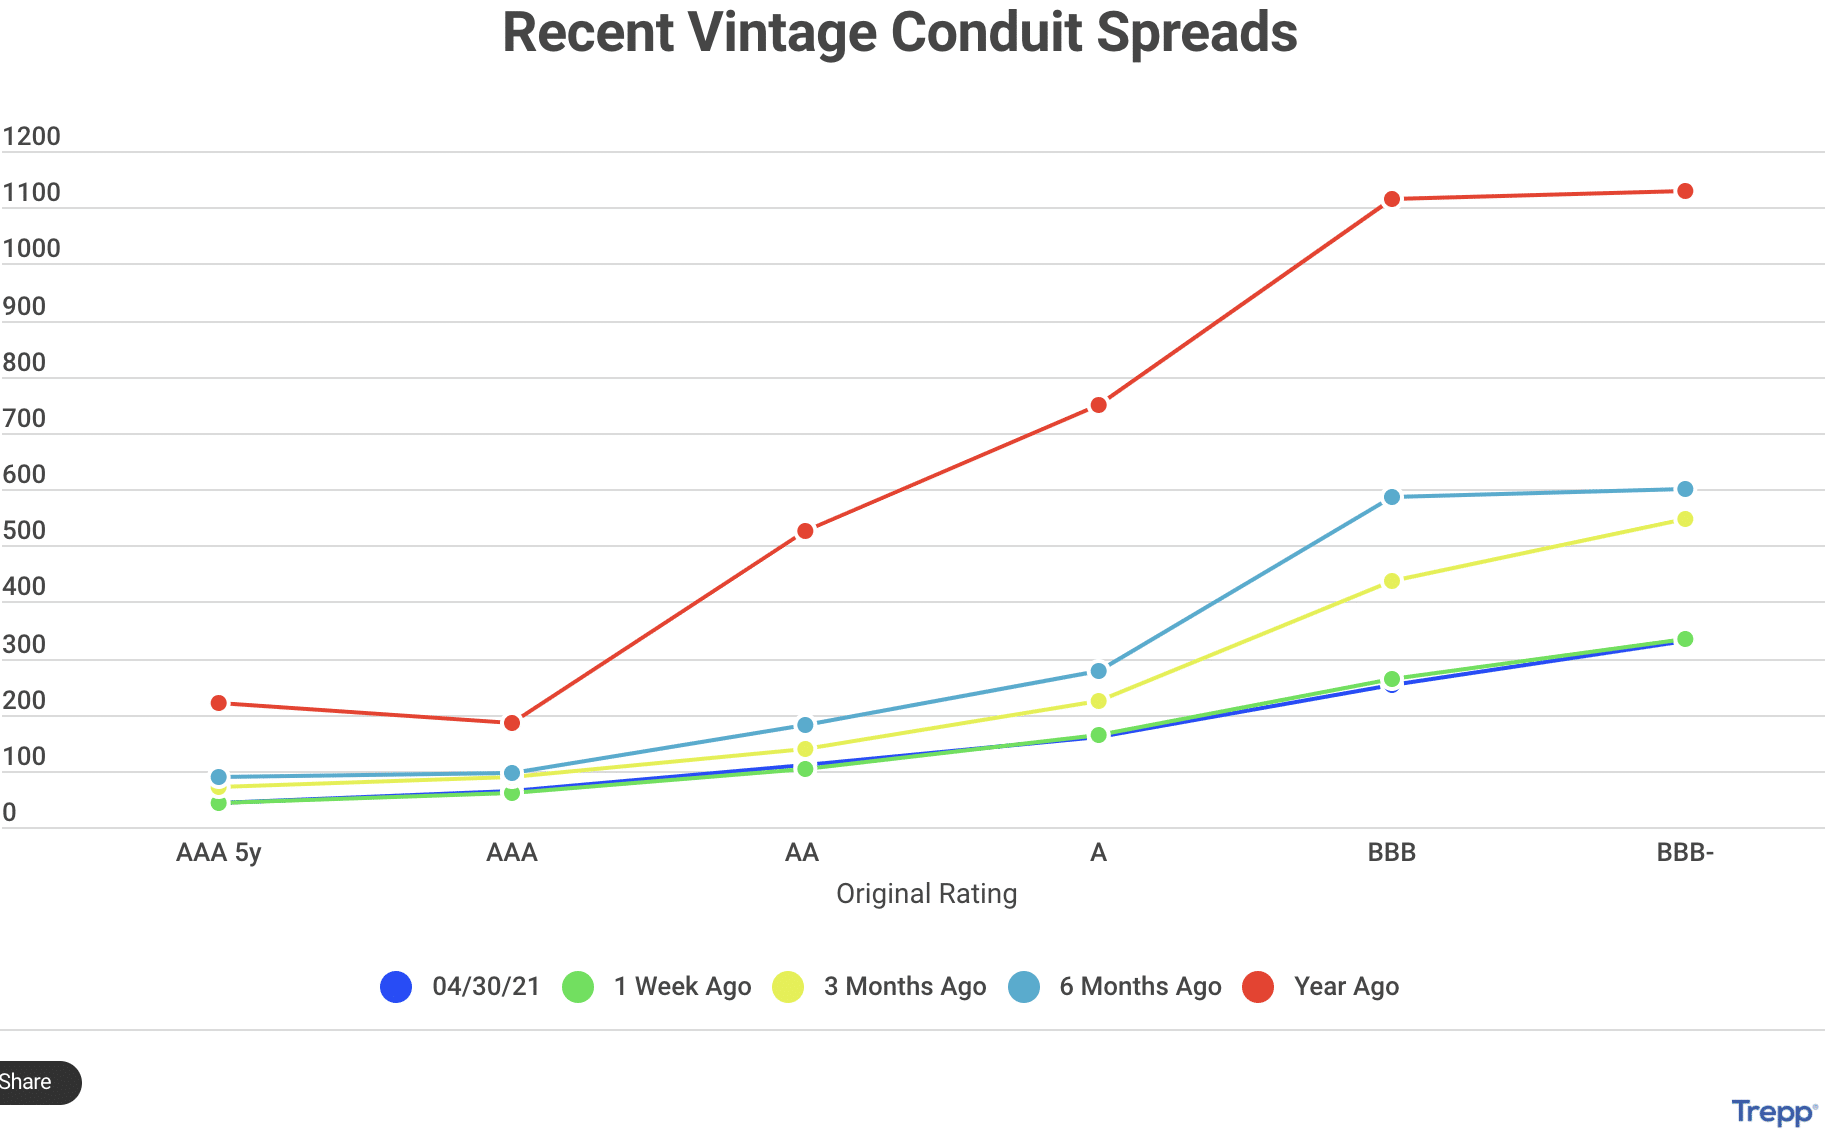
At times, period returns on AAA/AA tranches have underperformed due to widening of credit spreads over Treasuries. The worst of such instances occurred around the time of the Great Recession (2008) and the recent Covid pandemic, resulting in negative period total returns. (See Exhibit 2 for a recent example of spread changes.) However, for senior-tranche investors willing to ride out the volatility, the promised coupons and return of principal have been delivered.
Exhibit 2
“This time it’s different” is a refrain that is wrong nearly as often as it is sounded. Given the (to-this-point) robustness of the recovery from the pandemic-response-induced economic slowdown, sounding a warning call of impending disaster for the CMBS market would seem sorely mistimed. However, serious assessment of the prospects for any asset class requires considering a range of possible futures and estimating the probabilities and consequences of each.
Potential pitfalls for CMBS can be classified into two broad categories, though the subcategories under those headings are not independent variables. One grouping of factors are those directly related to the macroeconomic environment. The other grouping has to do with the way different types of commercial property may be impacted by new behavior in a post (perpetual?)-Pandemic world.
An important element of the economic considerations is the pace and durability of the post-Pandemic recovery. Setting aside the crosscurrents emanating from other factors, increases and declines in commercial property values tend to exhibit a lagged synchronization with economic strength and weakness. Therefore, any factor leading to a tepid or short-lived recovery cannot bode well for CMBS. The other primary economic influence is nominal interest rates through their sensitivity to rising inflation expectations. CMBS suffer two distinct negative effects from rising interest rates: commercial real estate (CRE) values are adversely affected through the impact on required cap rates (a widely used valuation metric), and higher mortgage interest rates negatively affect the after-financing net cash flows.
These economic factors are a sector-wide consideration. The factors driving potential intra-sector divergence of relative returns is more of a microeconomic/sectoral consideration: how will businesses alter operations in response to various technological and demographic trends, along with Covid becoming endemic in the population? Although likely to have consequences for several types of commercial property, it is office and retail space that may see the biggest adjustments in the long run. Changes in the desired floor space, driven by the confluence of improvements in communications technology and changes in behavior, may result in significant demand shrinkage. Against this drop in demand, adjustments to supply, typically through conversion of properties to alternate uses, may not reap as much value as during recent cycles.
Primer on Commercial Real Estate (CRE) and Commercial Mortgages
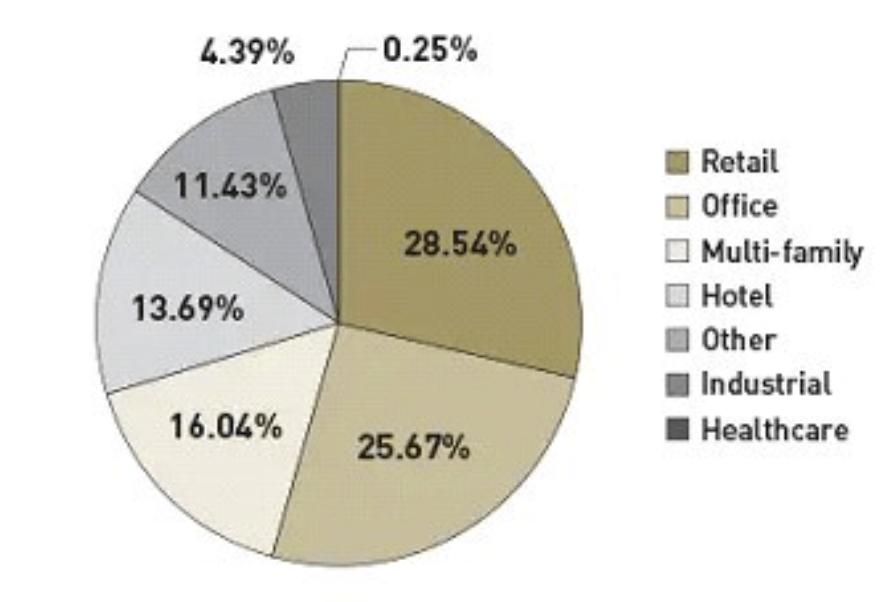
A brief overview of CMBS-related terms, definitions, and concepts may be useful for those not already familiar with the space. Commercial properties are generally those held to generate income, which includes multifamily residential (i.e., structures containing more than four units) and all properties in which other types of money-making activities are the primary purpose of the building. There are many categories and subcategories of CRE. Some of the major categories are listed in Exhibit 3, with a breakdown of the market by property type shown in Exhibit 4. As will be discussed below, the risks vary by category, so the distinctions matter.
Exhibit 3 Major Categories of Commercial Property
Multifamily Residential
Other
Conventional apartment
Senior living*
Student housing*
Low income*
Co-ops*
Retail (malls, buildings)
Office (buildings, campuses)
Industrial
Warehouse/storage
Healthcare
*Usually securitized by US mortgage agencies (FNMA, FHLMC and GNMA)
Exhibit 4
Source: Quinn Emmanuel Urquhart & Sullivan LLP
Most commercial mortgages differ greatly from loans used to finance the purchase of single family residences. As is common for single family residential mortgages, some multifamily residential properties are financed with long-term fully amortizing loans. However, most commercial properties are financed with balloon mortgages, typically with terms of between 5 and 12 years. Aside from interest only mortgages, such loans usually have monthly payments based on a 20- or 30-year amortization schedule. Loans configured this way result in an outstanding principal balance at maturity that requires a significantly larger (i.e., balloon) payment to retire the debt. The required balloon payment is often as much as 70-90+% of the original loan.
The loans are usually not paid off with money the borrower has accumulated over time. Common practice is to refinance the loan to make the balloon maturity payment. Such refinancings are a potential risk even in good economic environments – and sometimes result in a delayed return of principal. If a weak economy leads to significant declines in property values, refinancing the balloon may be difficult at best. This is a potential Achilles heel of the CMBS market.
Characteristics of CMBS: Capital Structure, Collateral Pools, and Special Servicers
Although sometimes structured as pass-throughs, most CMBS are structured as multiclass securities. Unlike pass-throughs, which entail proportional distributions of repaid principal and interest to all investors each period, multiclass (i.e., tranched) structures return principal according to a specified priority. Most CMBS are structured as a series of sequential-pay principal-and-interest tranches, with a seniority-based prioritization for the return of principal. Principal-and-interest tranches are usually paired with interest-only tranches that have interest payments based on a notional principal tied to the outstanding principal balance of the paired interest-and-principal tranche.
CMBS collateral pools are unlike the homogeneous loan pools typical of residential mortgage-backed securities (RMBS). RMBS pools usually contain loans on a single property type, all of which have similar loan types, interest rates, maturities, and principal amounts. CMBS are backed by collateral pools that can be quite heterogeneous as regards property types, loans, and maturities.
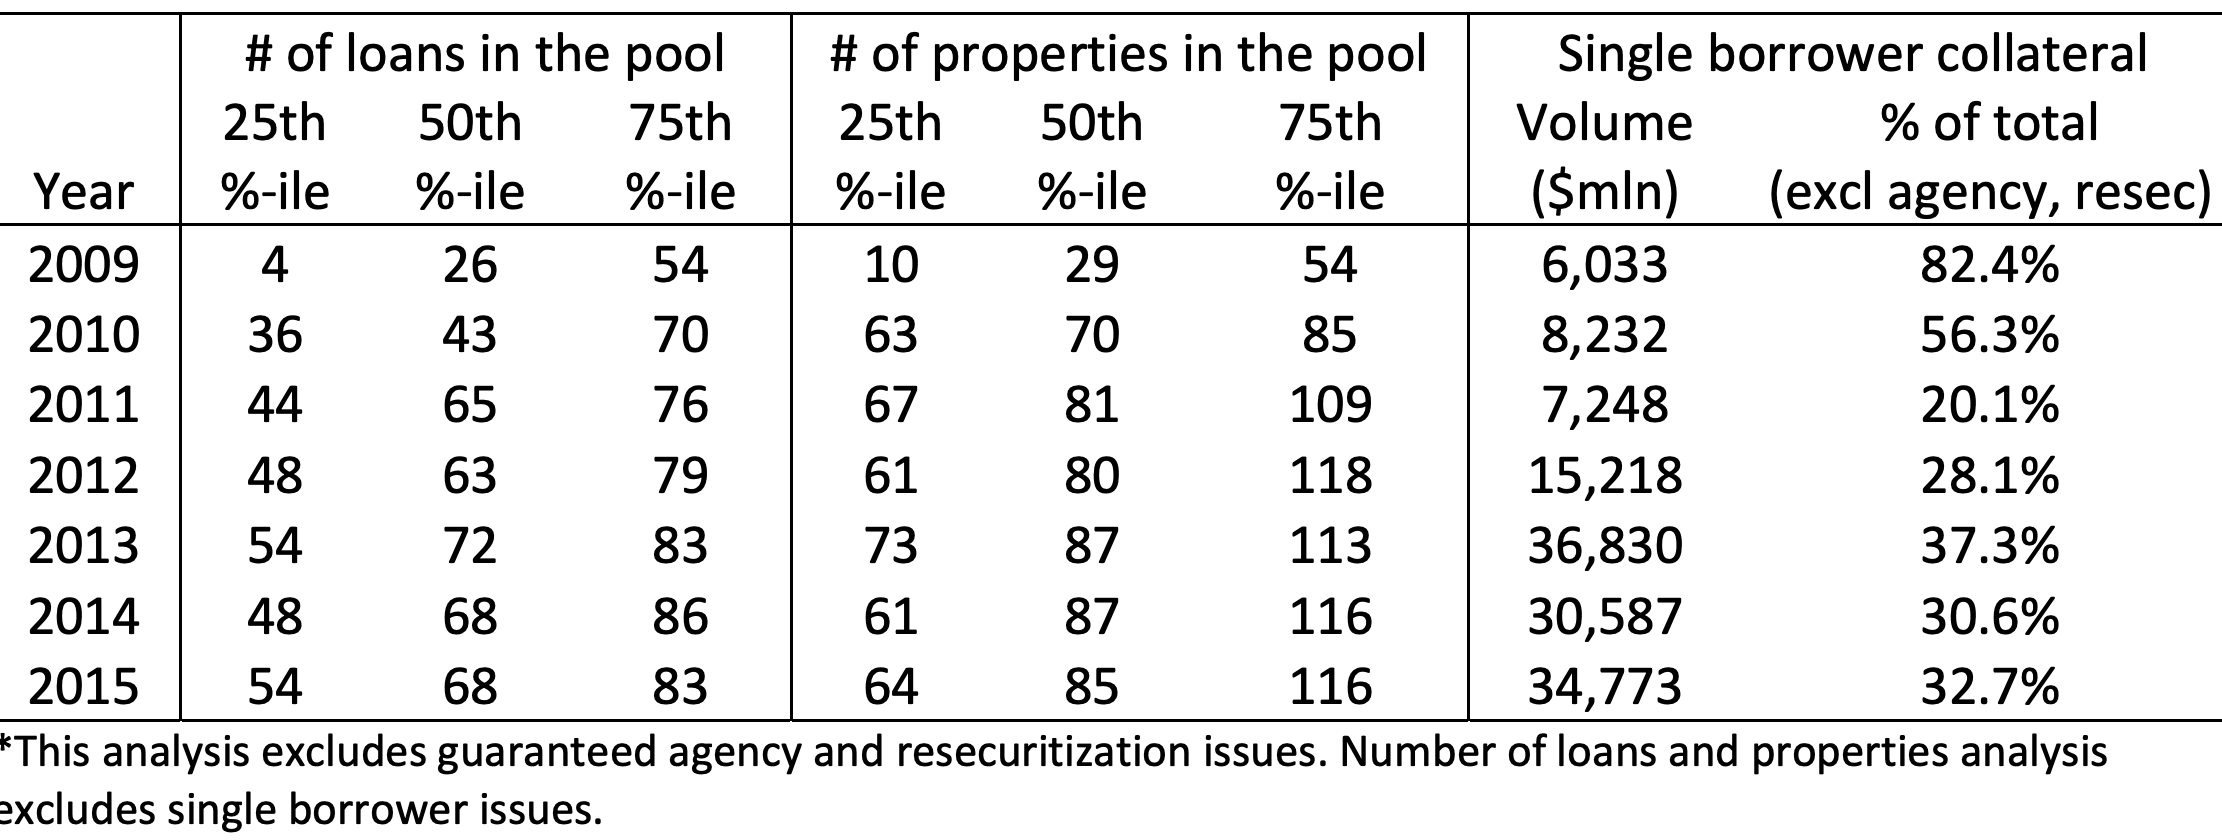
Exhibits 5-7 provide statistics on the universe on non-US Agency CMBS deals from 2009-151. Though the statistics reflect global issuance, from 2010-15 US deals accounted for approximately 95% of issuance. And while somewhat dated, the data provides a broad overview of CMBS collateral pools.
Exhibit 5
Loans and properties underlying global CMBS issues
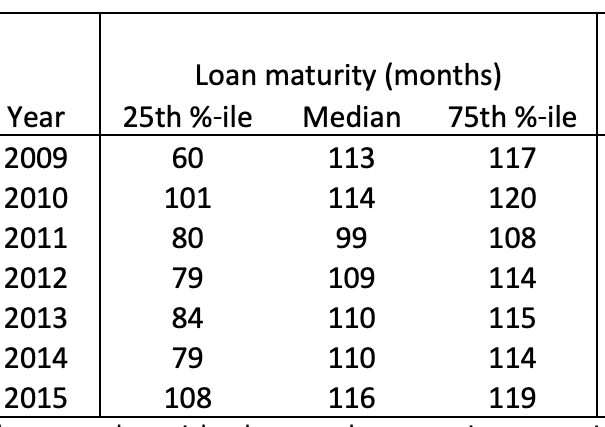
Exhibit 6
Loan maturity at issuance, by vintage
Several characteristics of CMBS collateral pools deserve comment. Perhaps most notably, CMBS collateral pools contain significantly fewer loans compared to RMBS collateral pools, which often contain hundreds or even thousands of loans. Furthermore, the loans tend to be significantly larger and loan sizes within a given pool vary greatly. The interplay of those factors results in 10-20% of the loans often accounting for a majority of the outstanding principal. Also, the most common types of properties in a given collateral pool merit special attention since average levels of default vary significantly by property type.
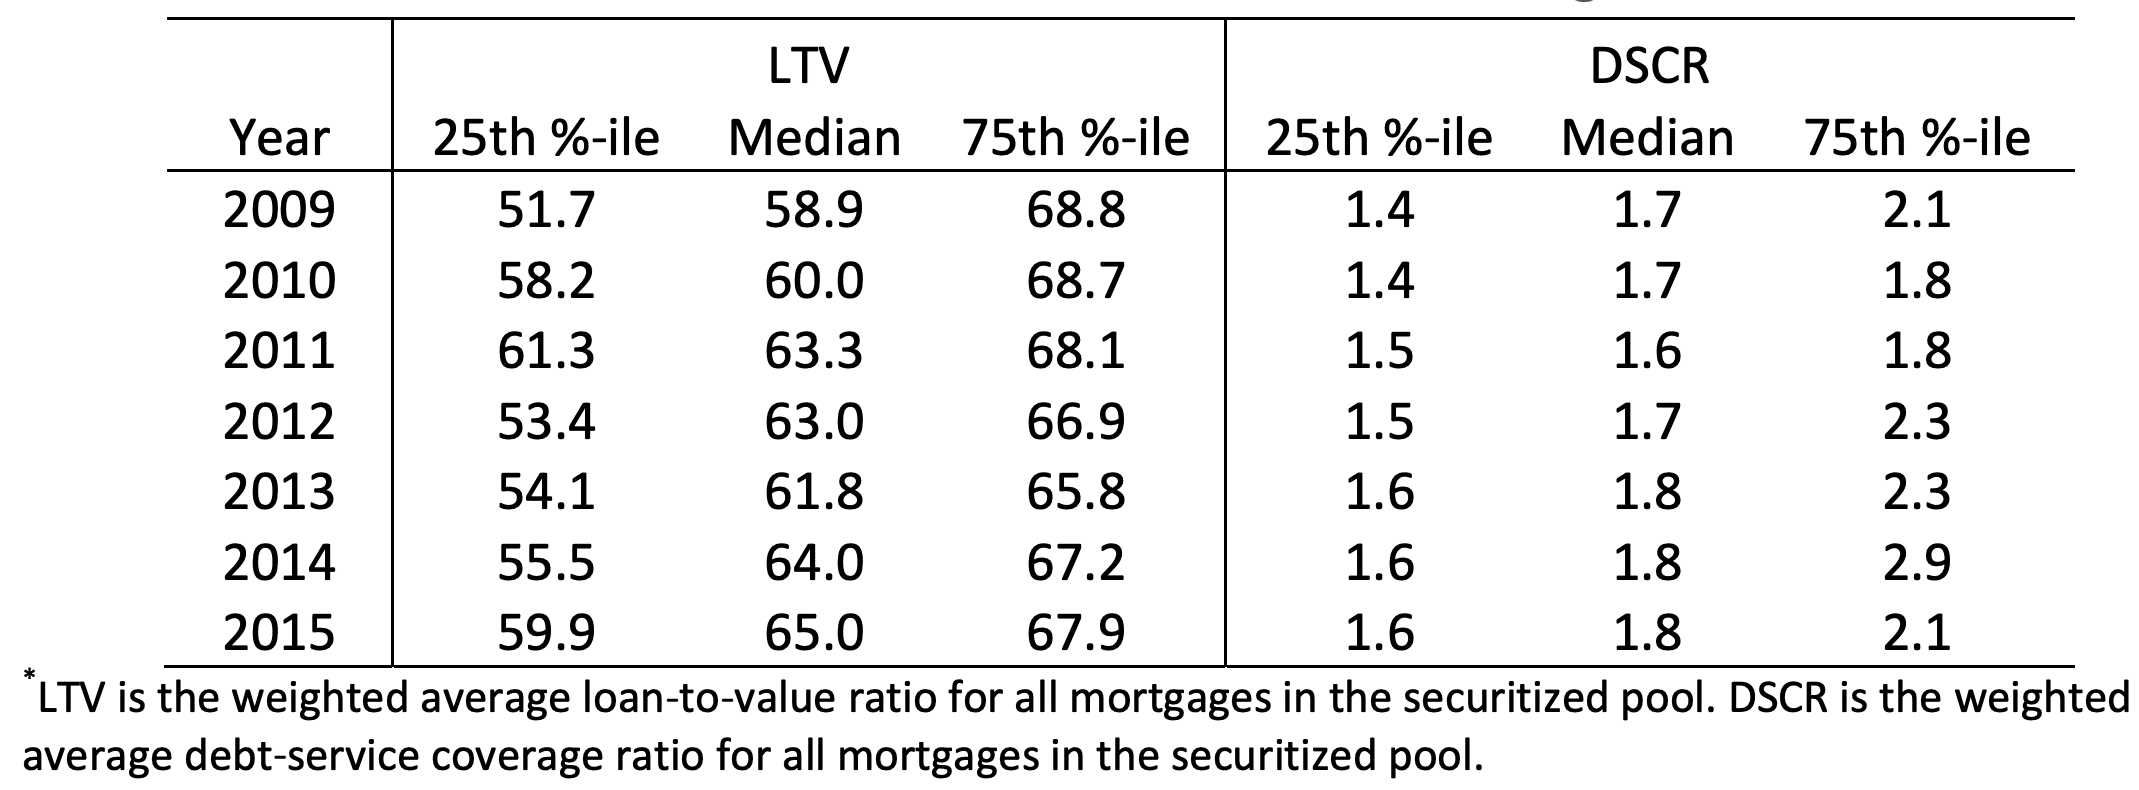
Let me highlight two items that may negatively impact CMBS returns: loan-to-value (LTV) ratios and the adequacy of subordinated tranches to fully insulate the other tranches from credit losses.
Exhibit 7 Loan-to-value (LTV) and debt service coverage ratios (DSCR)
Average LTV ratios would seem to provide robust credit enhancement for even the most subordinated tranches. However, reported LTV ratios may overstate the amount of protection provided by the mortgaged properties. In a paper released late last year (“Is COVID Revealing a CMBS Virus?”2), the authors noted a trend towards overly generous property valuations in CRE loan origination in recent years. Lenders were buttressing inflated property valuations with unduly optimistic estimates of the net operating income that mortgaged properties would generate.
Intense competition over origination fees may have led lenders to relax credit standards, manifested in part by generous valuations and amounts loaned. The lender’s ability to take possession of the property in the event of default is a characteristic of mortgages. However, the adequacy of this safety feature depends on the true value of the collateral, something called into question if property values have been inflated.
A study by Fitch Ratings3 further reinforces concerns over the adequacy of CMBS collateral. In 2020, average annual loan loss severity rose to nearly 58% – well above the mid-40%s typical of recent years. The study showed hotel loans suffered the highest average loss severity (75.9%), but loss severities were higher across all property types (e.g., office loans at 61%), including multifamily (46.3%) – usually the safest CRE category.
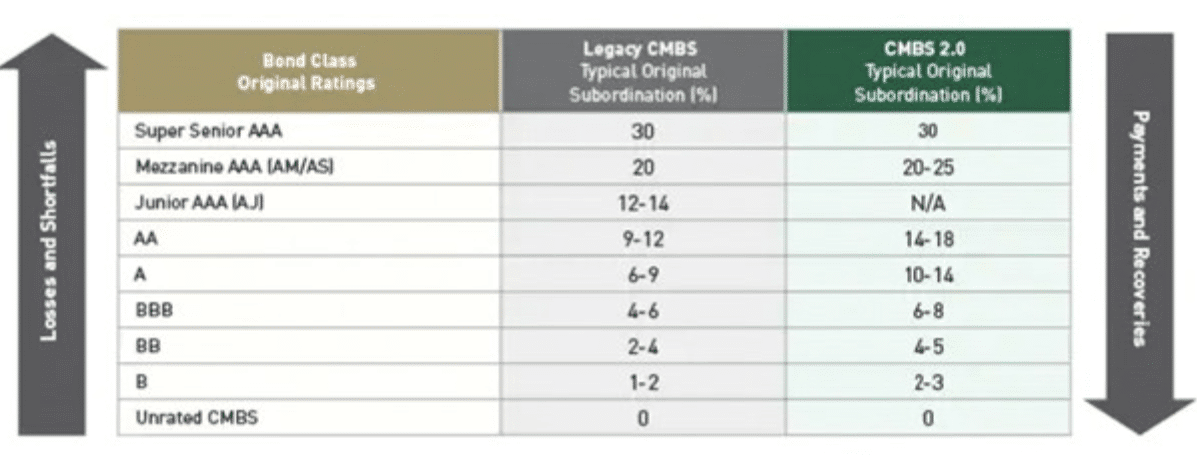
A related risk consideration is the degree of subordination, the primary credit enhancement protecting all but the junior-most tranche (usually a non-rated tranche retained by the sponsor that typically amounts to 3% or less of the initial principal balance; see Exhibit 8). For investors in all other tranches, especially those in the senior and mezzanine tranches, the second line of defense after property values is the prioritized allocation of credit losses on foreclosed loans. The junior-most tranche with outstanding principal absorbs credit losses in excess of any other enhancements. Once a tranche is written down to $0, losses are allocated to the next junior-most tranche.
Exhibit 8
Degree of Subordination
In most multiclass structures AAA/AA tranches are typically insulated by subordinated tranches that account for 20%/15% of the initial principal. Historically, that has proven more than adequate insulation from credit risk for highly-rated tranches. For these tranches to suffer write downs of principal, CRE values would have to decline by more than that amount in excess loan principal.
That would seem a low probability outcome. However, if there is a significant deterioration of central business district office properties due to reduced rental fees, high vacancy rates, broken leases, etc., the confluence of understated LTVs and the levels of subordination may prove inadequate to fully insulate senior tranche investors. This may be of particular concern for pools containing office property loans concentrated in less favorable geographies which also have large exposure to hotel and retail properties.
CRE and Commercial Mortgages Over the Past Year
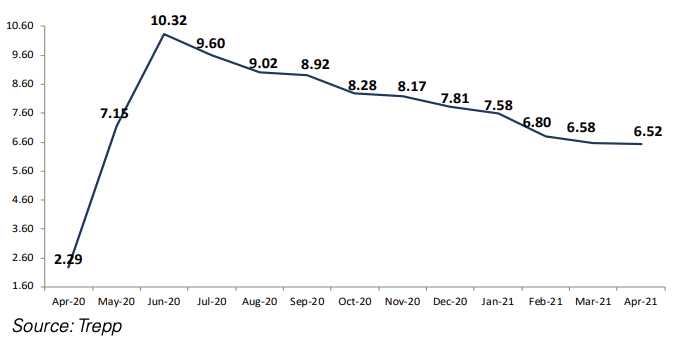
The consequences for CRE and commercial mortgages from Covid-related lockdowns, followed by the gradual reopening, have been as one would have predicted. As seen in Exhibits 9 and 10 below, a rapid increase in CRE delinquencies, starting in late Q1 2020 and peaking around mid-year, has been followed by a gradual but steady decline in the percentage of loans 30+ days delinquent.
Exhibit 9
Percentage of CMBS loans marked as 30+ days delinquent
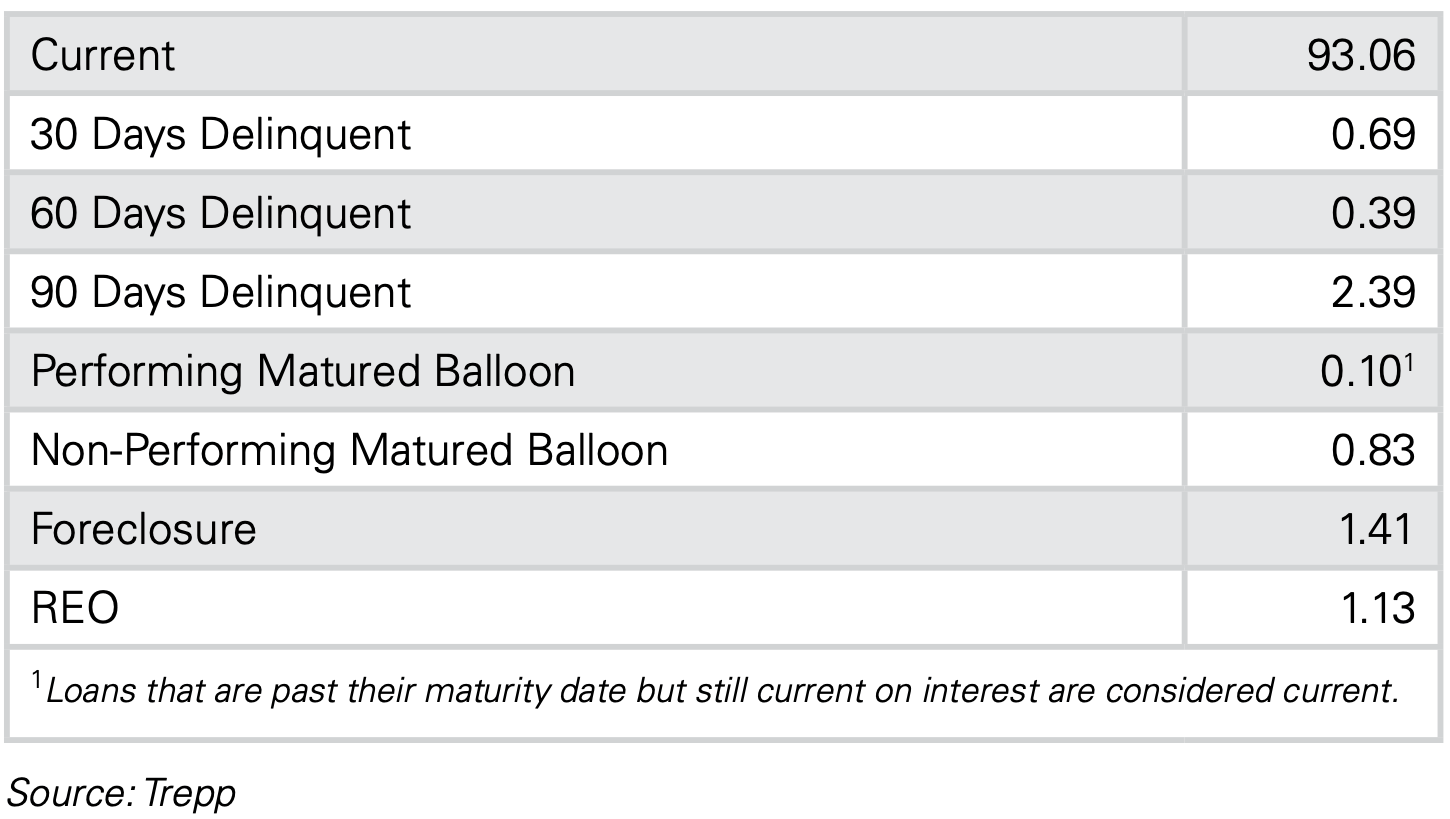
Exhibit 10
Delinquency status, May 2021
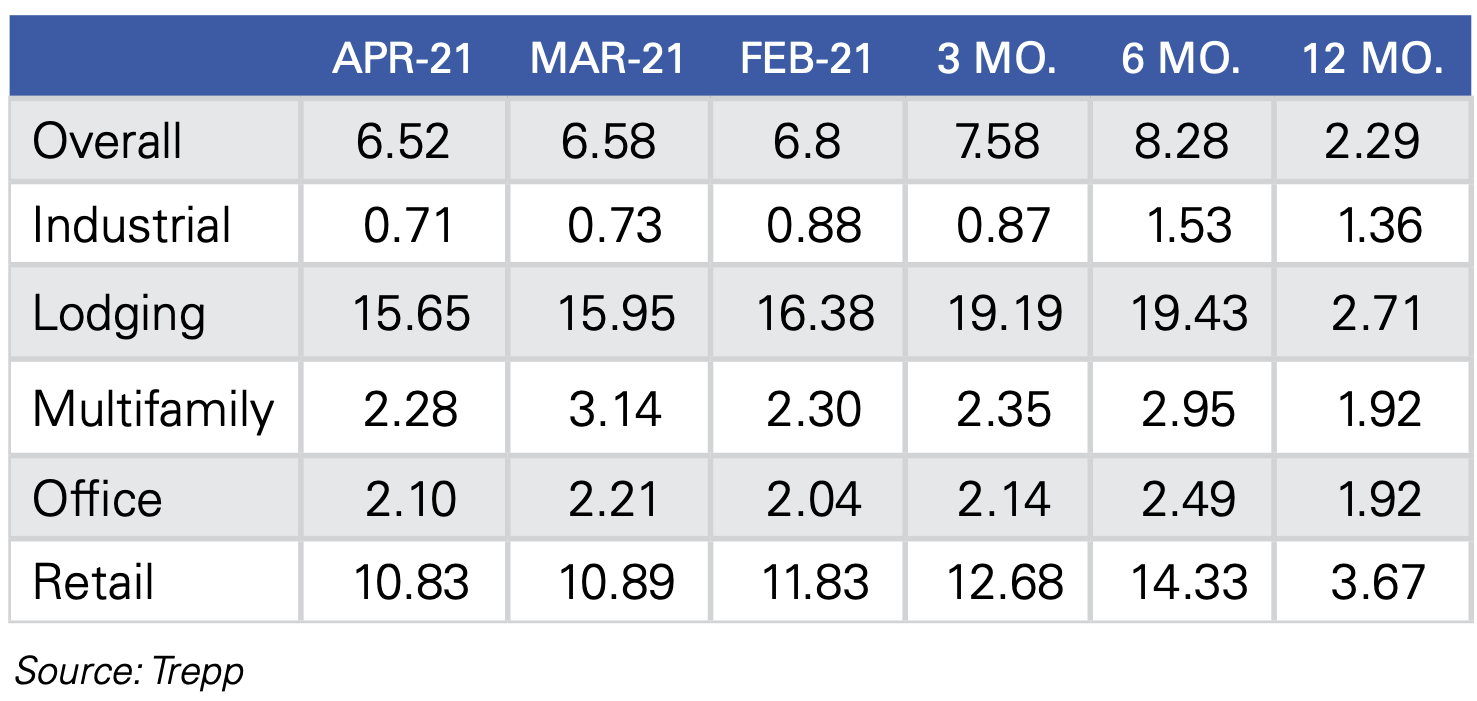
Unsurprisingly, the pain has not been shared equally across all property types as shown in Exhibits 11 and 12. Hotel mortgages have fared the worst, performing even more poorly than in the aftermath of the Great Recession. As a direct consequence of the near complete shutdown of business and leisure travel, hotel mortgage delinquencies exceeded 24% at the end of Q2 2020, and were still over 15% as of April 2021. The recent peak was 53% above the highest level reached following the last financial crisis and saw 24% of hotel loans in the hands of special servicers*4.
Exhibit 11
Delinquency rate by property type (% 30 days +), May 2021
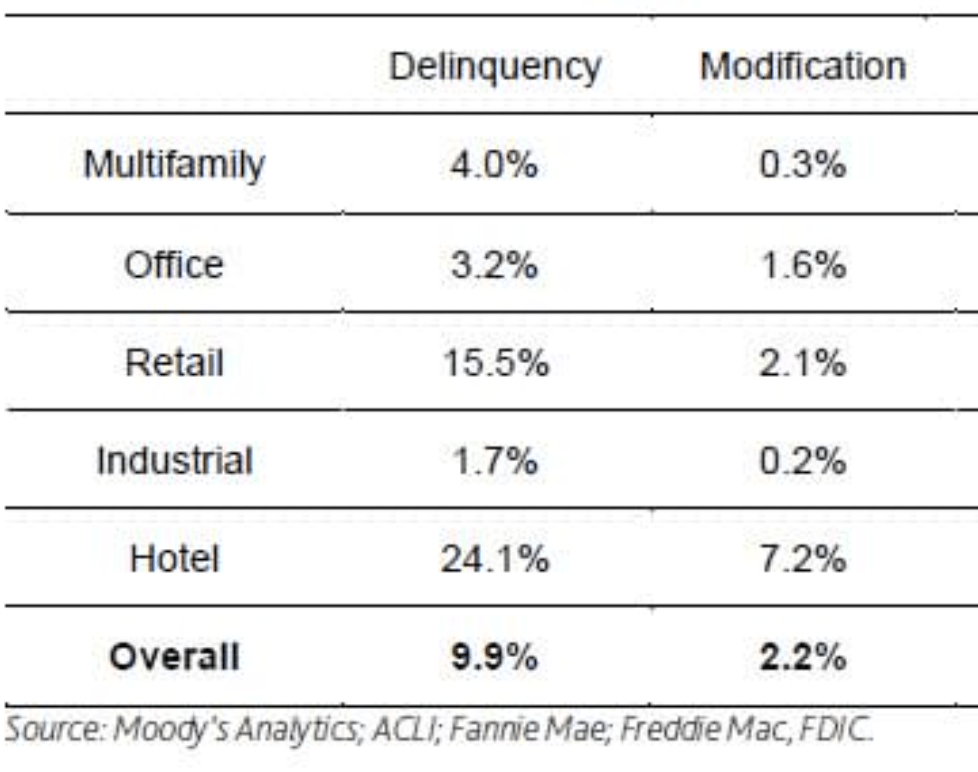
Exhibit 12
Delinquency and modification rates, 2Q 2021
Office property loans have not fared as poorly as loans on hotel properties, at least so far. Unlike the immediate decline in room rentals at hotels, office space revenue is more stable in the short run due to the multiyear leases typical of the sector. Unfortunately for office space, the Pandemic has provided a proving ground for remote working arrangements. At many companies, worker productivity has stayed the same or improved while working remotely. Given the cost per square foot in places like Manhattan, San Francisco, or Chicago, many companies are rethinking the need to maintain full-time, individually-assigned desk space for large workforces in some urban areas.
The responses of employers in SF and NYC may be a warning shot for office property values. Some employers have dispersed a portion of their workforces to less expensive metro or suburban locations. Some companies have even discussed revamping operations, moving from full- to part-time office attendance. Revolving/shared workspaces could replace full-time dedicated desks for all employees, who instead would perch at any available workstation for the 2-3 days a week they are expected at the office. These and other factors (e.g., improved morale, saved commuting time) may result in a reimagined way of organizing work. Such changes may result in a steep reduction in the demand for office space. The potential impact on property values, revenues, and ability to service/refinance property debt, is ominous.
Retail properties have been navigating in a challenging environment for many years already, the number of mall closures being but one of many manifestations of this sector’s difficulties. Covid and the related lockdowns have clearly reinforced this trend. Much of the decline in the immediate aftermath of the Pandemic will almost certainly be reversed to a degree with the relaxation of most state restrictions in the wake of vaccine-fostered reopenings. However, the forced experiment of increased usage of the internet for the purchase and acquisition of a wider range of products may result in a more rapid increase in online ordering and home delivery. The proportion of retail sales from in-store shopping is not likely to fully recover to their pre-Pandemic levels. Worse yet, the rate of decline relative to those better(?) days is very likely to accelerate.
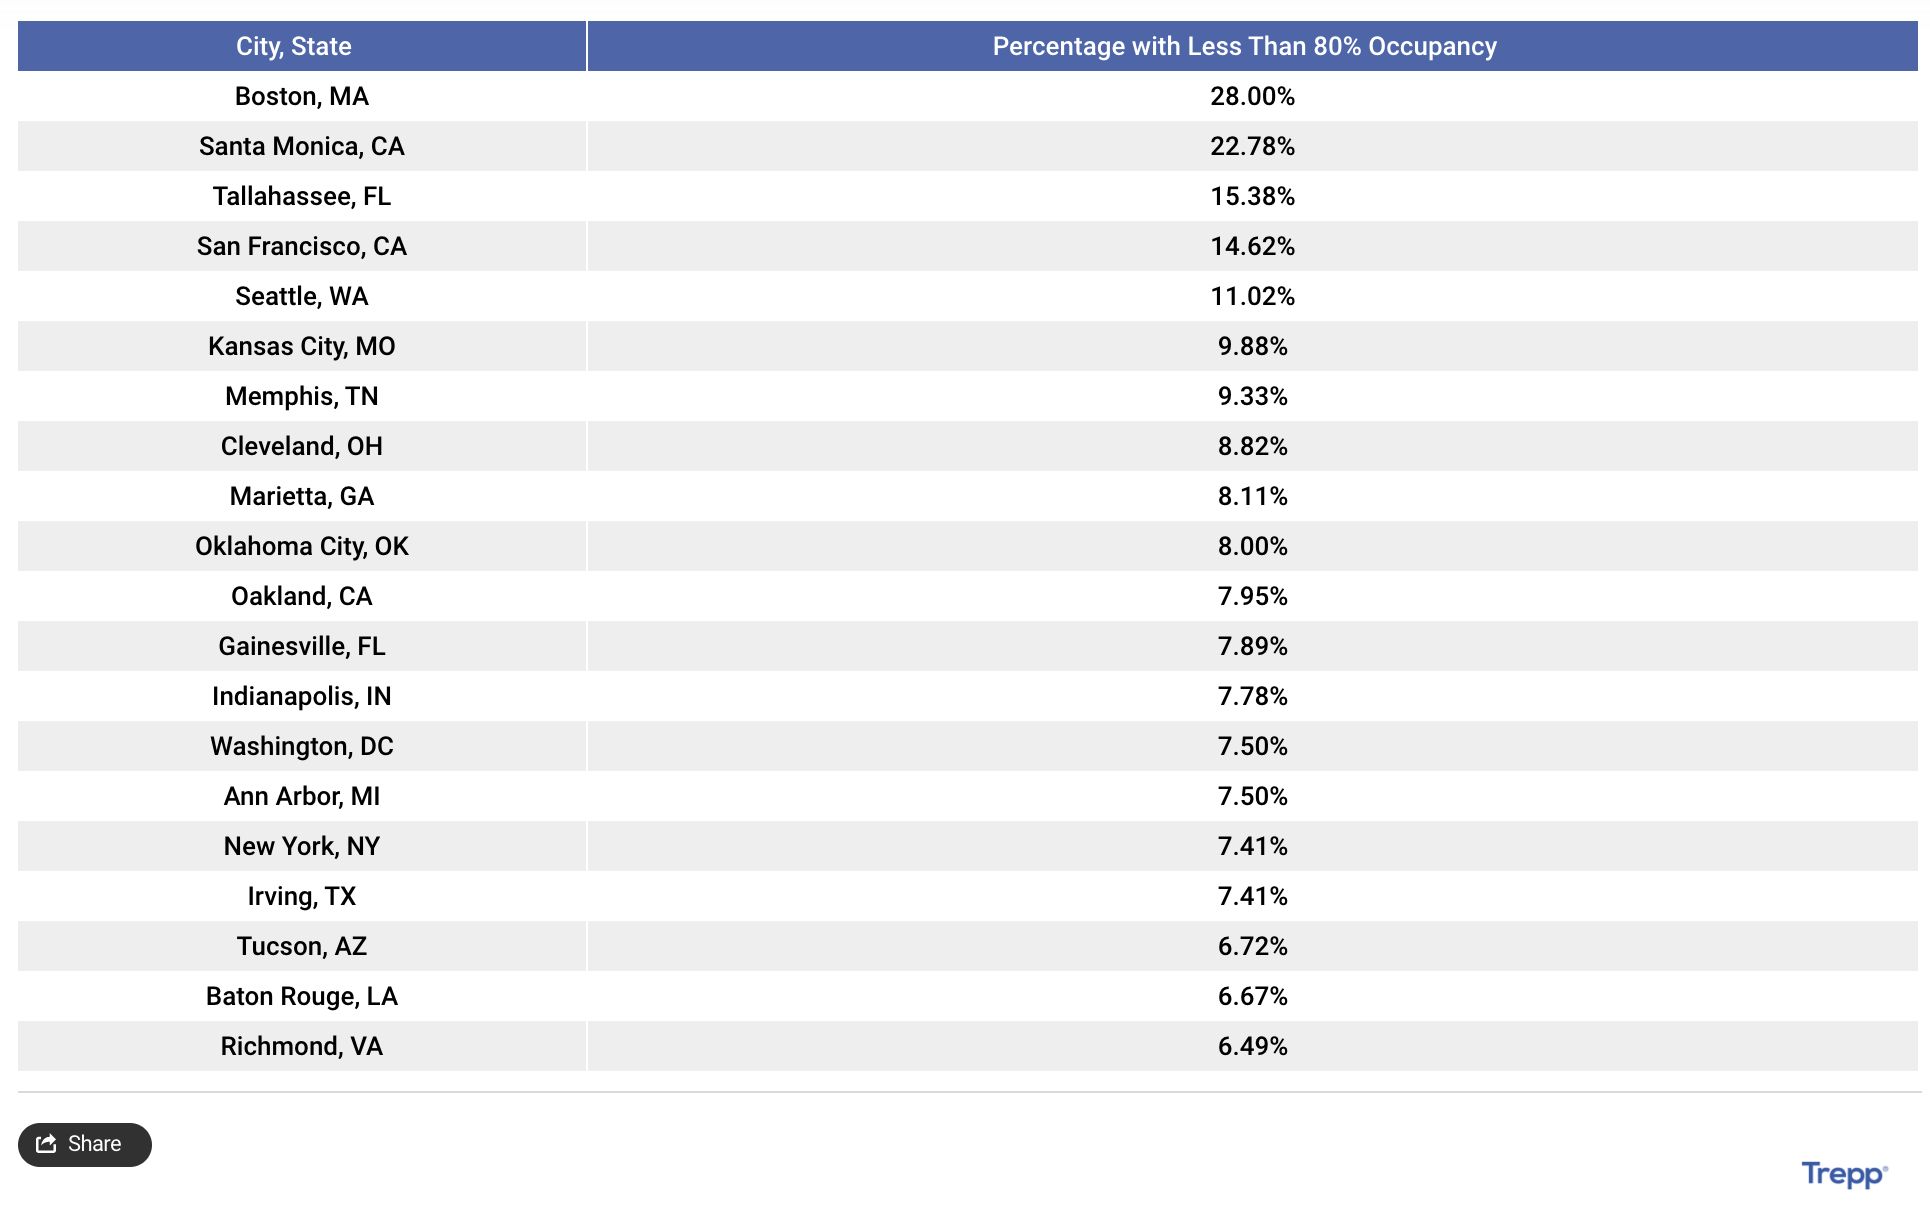
Even conventional apartments, historically one of the safest types of commercial mortgages, may not emerge unscathed. The apartment rent delinquency rate is on a par with recent years and has declined slightly over the past year5. However, that positive factor should be balanced against the relatively low occupancy rates in many metropolitan areas (see Exhibit 13). A strong recovery of the economy and related jump in wage income would seem to portend relief for landlords. The outlook depends on the continuation of the economic recovery.
Unsurprisingly, the biggest driver of performance for CMBS, as an asset class, will be the growth path of the economy. Within whatever economic context transpires, the relative returns on particular securities will be greatly influenced by deal-specific factors such as type and location of properties, credit quality of loans, and degree of insulation from principal write-downs afforded by credit enhancements. Let’s deal with the factors driving relative performance first.
Office building rents are likely to be under pressure due the factors cited above, though there is likely to be very noticeable interregional tiering of these impacts. Indeed, due to the less onerous restriction and more expansive re-openings, office space rents in states such as Texas and Florida will continue to increase, perhaps at an accelerating pace absent the onset of a severe recession. However, in states such as New York, California, and Illinois, the combination of more restrictive Covid-related policies, less business-friendly environments, and the very great likelihood of increased taxes will almost certainly result in lower than previously anticipated increases in rental rates – if not outright declines. An indication of the potential weakness is the very low rates of office occupancy (e.g., NYC at 18.2%, SF at 16.8%) in major cities 6 months into the recovery. It is essential for investors to evaluate the collateral pool, especially where there is significant exposure in less dynamic regions exhibiting an anti-business tilt. Where such exposure is significant, it is crucial to assess the sufficiency of collateral and credit enhancements to weather any decline in property values and projected revenues.
Hotel properties are most likely to perform in a fashion consistent with their experience over recent decades. With the increasing prevalence of vaccinated populations, occupancy rates are most likely to mirror the cyclical trends in business and leisure travel. Absent the evolution and spread of vaccine-resistant strains of Covid, with a robust and prolonged economic recovery (bolstered by pent-up demand from prolonged enforced cloistering) hotel occupancy and room rental rates should rebound nicely. That would bode well for this sector of the CRE market, though businesses’ experience with virtual meetings may impact any rebound at the margins. The primary cautionary consideration for this sector relates to the strength and tenure of the current economic resurgence.
The prospects for retail properties are not bright, no matter the course of the economy. The question is one of how rapidly retail square footage is likely to shrink. CBRE Group is forecasting a 20% decline by 2025 even while predicting improvements for nearly all other property types in what it generally sees as an improving economy.7 Retail mortgages had the highest delinquency rate of all property types leading into the Pandemic and then spiked by more than 300%. As of April, the delinquency rate in this sector was still over 3x pre-Pandemic levels (see Exhibits 11 and 12). Though as always, the prospects for individual mortgages depend on age of the structure and location of the property, a serious economic downturn bodes a contraction for retail even worse than foreseen by CBRE. Losses on foreclosures would then be even more likely, due to a more rapid shrinkage of demand for brick-and-mortar retail space, and losses in property values on their conversion to lower-rent activities (e.g., warehouses, fitness centers).
Less subject to economic vagaries than other property types, conventional apartment mortgages’ primary exposure is political. The demand for living space is mostly a function of demographics. As a consequence, apartment properties’ rental income is more stable compared with hotel or office properties. The biggest risk to apartment owners (and by extension mortgage holders) is the impositions of eviction moratoriums. Absent compensatory benefits to landlords (e.g., forgivable loans tied to rent forbearance), protracted restrictions on evictions for non-payment of rent is the biggest source of risk in the apartment sector. Though well intentioned, the eviction prohibitions may create some moral hazard, as rent forbearance has been exploited in some cases by renters gaming the system. Especially if the economic recovery falters, vote-seeking politicians may be incented to reimpose or extend eviction moratoriums. As with office properties, this effect is likely to exhibit great regional variation, from a non-issue in some locales to a serious consideration in other areas. I suspect that of the four types of properties addressed here, conventional apartments are the least likely to suffer adverse impacts. That holds true even if the economy were to enter a protracted recession.
The most telling factor of all will be the course of the economy. Two facets of the issue were cited earlier, the real economy and interest rates. Consider how both facets are likely to be impacted by US economic policies.
Government spending already represents the largest share of GDP in US history outside of WW II and there are proposals for further large spending initiatives. According to some economists, there is an inverse correlation between share of GDP represented by government spending and economic growth. Further, the tax increases proposed to partially pay for the planned expenditures are types of taxes (e.g., corporate profits, capital gains) that have historically proven to have the largest anti-growth impact. If history is any guide, the consequences of such spending-and-tax increases would, at best, lead to lower rates of real GDP growth.
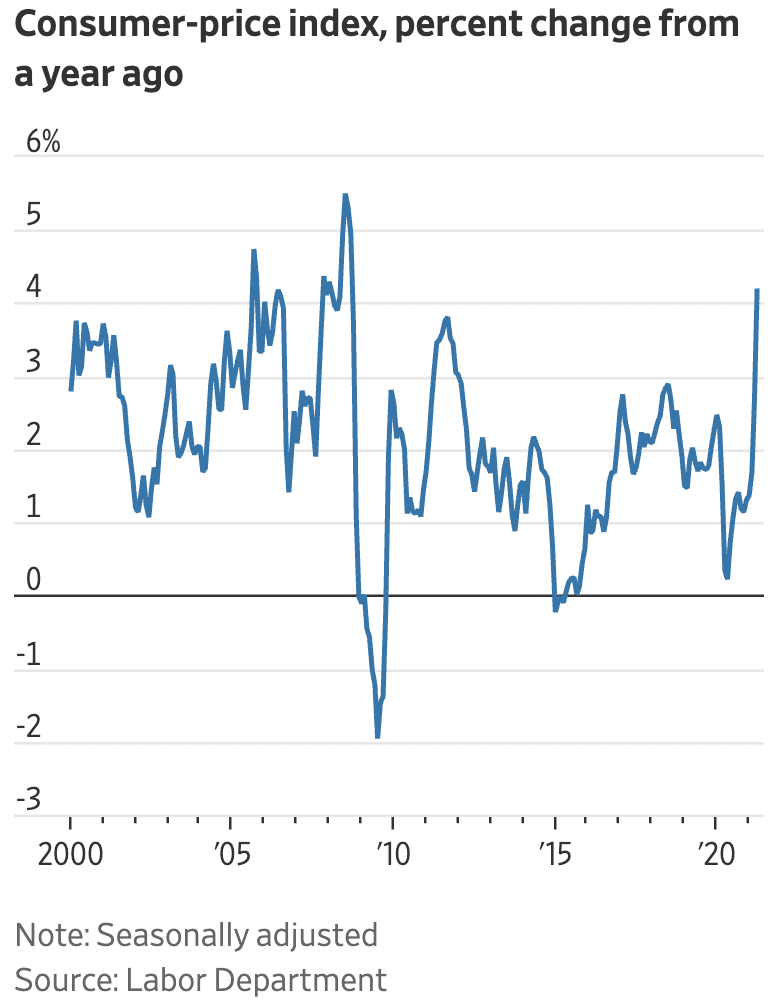
Of perhaps even greater concern is the likely future course of interest rates. Though inflation is still low by historic standards, over the 12 months through April 2021, the Consumer Price Index (CPI) rose by 4.2%, the highest rate in over a decade (see Exhibit 14). That dubious achievement was surpassed the following month by a 5.0% increase over the year through May 20218.
Despite the Fed’s promise to keep rates low for several years, Treasury Secretary Yellen let slip the reality that increases will likely come sooner than previously anticipated due to rising inflation expectations. This is a consequence that should have been expected given the over 30% expansion of the money supply (M2) and approximate doubling of the Fed’s balance sheet since the onset of the Pandemic9. Though proponents of MMT (magical monetary thinking, er, Modern Monetary Theory) like to cite the absence of inflation despite the very expansionary Fed policy in the aftermath of the ’08 Financial Crisis (i.e., QEs 1, 2, 3 and 4ever), that is not really an apt analogy. In that earlier instance, the primary increase was in bank reserves, not M2. The Fed effectively froze reserves in the banking system by (for the first time in its history) paying interest on excess reserves. This time, Fed actions have greatly expanded the money supply, with likely more to come.
Exhibit 14
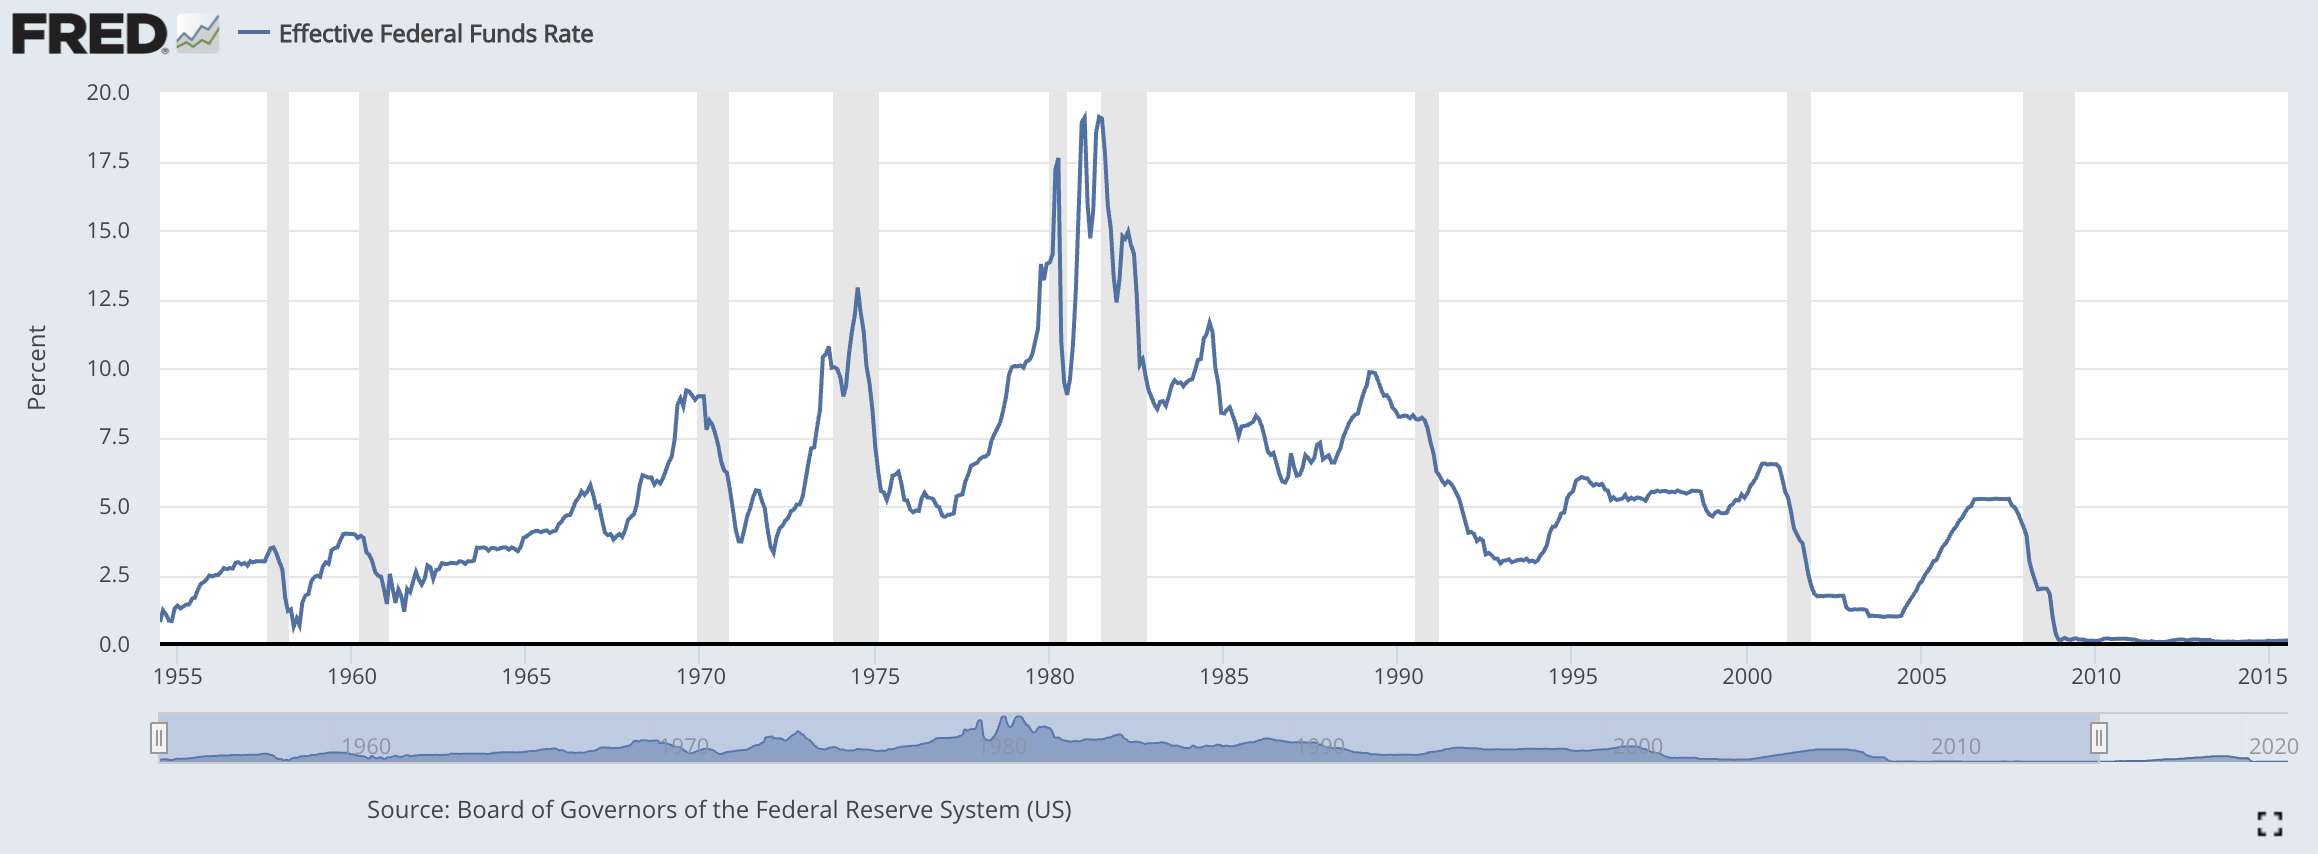
With the exception of the Covid lockdown-induced recession that started in February 2020 (as adjudged by the Solons on the government committee responsible for officially dating such things), every recession in the last 50 years followed in the wake of Fed tightening (see Exhibit 15). In every instance, contractionary monetary policy was intended to dampen rising inflation expectations. In those cases where the Fed delayed implementing such policies for fear of dampening GDP growth, the subsequent tightening was all the more aggressive to make up for lost time. I greatly fear that contractionary policy, pursued only after inflation has already become a significant problem, will be the case in this cycle as well. Given the public communications of Fed Chairman Powell and other worthies on the Federal Open Market Committee, it would be unreasonable to expect anything different.
Exhibit 15
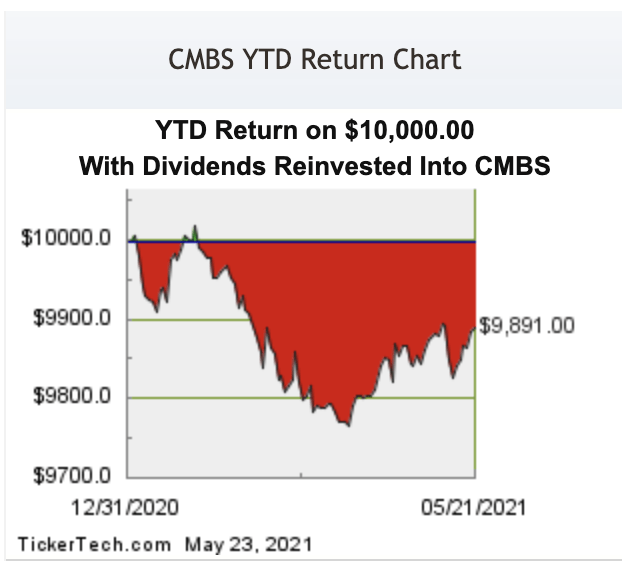
The performance of CMBS exchange-traded funds (ETFs) is a forward-looking indicator that may provide insight into investor expectations. Exhibit 16 shows the year-to-date performance of an index of CMBS ETFs. Despite many US equity indexes regularly reaching all-times over the course of 2021, CMBS ETFs have shown a cumulative, albeit slight, loss. However, on a relative return basis CMBS have dramatically underperformed large-cap (+12-13%), mid-cap (+18%) and small-cap (+22%) equities10. With so much money sloshing around the financial system looking for a home, the relative underperformance is sounding a clearly cautionary note for CMBS as an asset class.
Exhibit 16
Notwithstanding all of the foregoing, a strong and enduring economic recovery will patch over many of the above stated concerns regarding CMBS as an asset class or particular issues cited with respect to specific property types or loan underwriting issues. However, if there is a truncated recovery, many of the downsides identified previously come into play. An adverse economic environment could arise due to unintended contractionary impacts of fiscal policy, or due to restrictive monetary policy. The confluence of the two would be particularly toxic.
My hope is for benign and appropriate actions on both the fiscal and monetary fronts. Unfortunately, the stated policy intentions for government spending and taxation do not bode well for GDP growth, and published inflation targets and interest rate projections by the Fed seem unmoored to any historical precedents. If the economy is tipped into recession by economic policy miscues or other factors (e.g., global slowdown, Pandemic redux), a CRE sector not fully recovered from the 2020 Covid slowdown is likely to underachieve relative to its typical underperformance in cyclical downturns. In that event investors may want to avoid lowly-rated tranches across the board – except where their analysis concludes a collateral pool is bullet proof. Even AA and A-rated tranches may have exposure to principal losses where there is significant exposure to office, hotel, and retail mortgages, unless located in regions better situated to maintain strong local economies despite the travails at the national level.
Footnotes
1 Securities and Exchange Commission Whitepaper: Issuance Activity and Interconnectedness in the CMBS Market 1 Diana Knyazeva, Charles Lin, Jasmine Park, August 2016
2 Is COVID Revealing a CMBS Virus, John M. Griffin, Alex Priest, November 2020
3 Fitch Ratings, US CMBS Loan Loss Study, June 2020
4 Trepp, Historical CMBS Report: An Update on Hotel Commercial Real Estate, August 2020
5 NMHC Rent Payment Tracker, National Multifamily Housing Council, May 2021
6 Kastle Systems, Kastle Back to Work Barometer: Weekly Occupancy Report from Kastle Access Control Systems Data, 31 May 2021
7 Chain Store Age, 12 November 2020
8 U.S. Labor Department, 10 June 2021
9 Board of Governors of the Federal Reserve System (US), Weekly observations through 3 June 2021
10 S&P Dow Jones Indices, data as of 28 May 2021
*The role of the special servicer deserves at least brief description for those not familiar with CMBS. A special servicer is normally not involved in the collection and disbursement of funds (handled by the subservicers) so long as loans are performing. Special servicers get involved once a loan is in arrears, at which point the special servicer assumes responsibility for managing the relationship with the borrower. Special servicers are usually empowered to decide on the best course of action to maximize the economic outcome for the investors. (Though it is worth noting, in more than a few instances special servicers have been accused of pursuing courses of action that maximize their returns rather than benefiting investors.)
Special servicers can renegotiate the terms of the mortgage: lengthen the maturity, change/reduce the interest rate, or write off a portion of the loan. For loans where problems are deemed temporary in nature, special servicers may advance the payments of delinquent borrowers to avoid negative impacts on the collateral pool cash flows and distributions to investors. If a special servicer decides that foreclosure is the best alternative, the property can be sold or taken over and operated by the special servicer as real estate owned (REO).
About the Author: Doug Carroll
Doug Carroll has been conducting investment training seminars in major financial centers around the globe for more than two decades. His varied experiences in sales, trading and investment management allow him to draw upon an unusually broad range of professional activities to demonstrate in the classroom practical applications of training program content. This is supplemented by a rigorous grounding in the legal, regulatory, and theoretical aspects of the financial markets gained while earning numerous professional licenses and pertinent college degrees, including master’s degrees in finance and economics. His presentations are informed by a wide variety of financial market related experiences.
Doug has extensive professional experience developing and delivering investment training programs. He has taught at numerous financial training companies and financial institutions for both open enrollment and internal learning programs. Audiences and topics have run the gamut from “Introduction to the Securities Markets” for industry neophytes to “Advanced Derivatives” for portfolio managers and trading desk personnel. He has presented training programs in most of the major financial centers in Asia, Europe, and the Americas.
Doug holds an MBA in Finance from the University of Chicago, an MA in Economics from Northern Illinois University, and BAs in History and in Economics from Northern Illinois University.