
Encountering a New Standard
“That did not go too well” said Barry, my investment expert friend as we left the testing center. He was an extremely intelligent financial expert who would later become well-known for uncovering an infamous financial fraud. But on this day, he correctly anticipated that he had failed the Level I CFA exam.
Have you ever failed a test? Have you ever fallen short in an athletic competition?
Of course all of us fall short at times. Sometimes, like Barry, we just didn’t prepare enough for the moment. Our solid performance in one context (like Barry in his current job) causes us to over-estimate our ability to perform at a higher standard in another context. Sometimes the unwanted failure notification letter (or unwanted examination findings) can be a productive catalyst to elevate our game, as Barry did passing all three subsequent exams and rising to great heights in his profession.
Evolving Standards of Bank Risk Quantification
Unfortunately for bankers, standards do not remain constant, and much can change in a decade. Reflect with me for a moment on the accepted standard for interest rate risk quantification in 1990. The Savings and Loan Crisis (S&L crisis) was winding down and it had become obvious that banks needed to do a better job managing their interest rate risk.
The vast majority of banks in 1990 measured interest rate risk with simplistic “gap” reports that captured repricing risk, but did not effectively capture other types of interest rate risk (option risk, yield curve risk, or basis risk). A few pioneering banks entered the world of “earnings simulation” modeling to better manage their interest rate risk profile. By the 1996 issuance of the joint agency policy statement on interest rate risk, earnings simulation modeling was already common at community banks and by 2000 you’d be hard-pressed to find even a small community bank that had not begun using earnings simulations.
The decade starting in 2010 promises to bring changes as profound to credit risk quantification as the decade of the 1990s brought to interest rate risk quantification. Instead of the S&L crisis, by 2010 we were heading out of the credit hangover of the Great Recession. Even without regulatory impetus, larger banks that had nearly failed the ultimate capital test (solvency) were committed to improving credit risk quantification since erroneous assumptions in this area caused viability-threatening losses.
By the time interagency stress testing guidance was issued for large banks (over $10B) in May 2012, the benefits of stress testing were obvious among risk professionals and several years of mandated credit stress tests had already been performed at the largest banks using macroeconomic projections provided by the Federal Reserve for three economic scenarios (baseline, adverse, and severely adverse).
Evolving Standards of Credit Stress Testing Practices in Community Banking
In concert with the large bank stress testing guidance of 2012, regulators articulated community bank credit stress testing guidance in supervisory bulletins (OCC 2012-33 Community Bank Stress Testing Guidance1) and articles (FDIC Supervisory Insights Journal: Summer 20122).
Further clarification has been provided during examinations. In June 2014, a $500 million client of my organization, Darling Consulting Group (DCG) received the following comment requiring “corrective action”:
“Management must perform portfolio-level stress tests to quantify the impact of changing economic conditions on asset quality, earnings, and capital over the short-term and long-term (at least a two-year period).”
Comments such as these provide clear evidence that the standard for credit stress testing is evolving. By 2020, we may view the incorporation of changing economic conditions into the stress testing process as routinely as we view earnings simulations today.
Preliminary research has suggested that 70% of community banks already do some form of credit stress testing. However, if “performing portfolio-level stress tests to quantify the impact of changing economic conditions” is the new standard, most are failing significantly.
Most often, we’ve observed management credit stress testing that looks at an individual bank’s worse case experience (in a given year) and multiplies this by different factors (for example, 1x, 2x or 5x) to get alternate results. In fact, such simplistic approaches were sometimes employed by banks over $10B prior to the new Dodd Frank Act Stress Testing (DFAST) requirements.
Regulatory Gift to Community Banks
Have you ever sent a thank you note to a regulator?
I believe that the annual publication of Federal Reserve scenarios (baseline, adverse, and severely adverse), particularly when combined with the history of the same macroeconomic factors back several decades, is a risk management “gift” that will soon be opened by many community bankers.
Indeed, at DCG we view the three Federal Reserve scenarios as a “safe harbor” assumption for projecting future economic conditions. While some banks may elect to project their own economic conditions, such scenarios require more support and discussion that can be avoided with the acceptance of the regulatory “gift.”
Leveraging the Gift: Projecting Expected Losses
When given several decades of macroeconomic factors, many large banks have used statistical regression to identify mathematical relationships between variables and to produce predictive equations (models) that are ultimately used to estimate expected losses.
At DCG, we assist community banks in projecting expected losses using a 3 step regression approach:
- Gather economic drivers: Accept the regulatory “gift” of 16 domestic variables, and this gives you those independent variables.
- Gather net chargeoffs: Use regulatory filings of all banks under $10 billion, and that produces dependent variables.
- Build robust statistical models: Use statistical software to select the best available model from all candidate models.
After building predictive equations for each major loan portfolio, we can simply input the Federal Reserve projections over three years into the equations to project quarterly expected loss rates over 13 quarters. These expected loss rates can be converted to dollars by multiplying portfolio balances at the start of the exercise.
Expected Loss Quantification Review
In 2014, most community banks use internal loan rating systems (numerically increasing in risk) with final categories that parallel regulatory adverse classification categories (substandard, doubtful, and loss). For example, if a community bank had an internal credit rating scale of 1-7 (where categories 5, 6, and 7 were substandard, doubtful, and loss, respectively), management would expect lower credit losses on loans rated 2 or 3 than loans rated 5 or 6. This higher expected loss for riskier loans is analogous to credit approaches used by larger institutions, but not as mathematically precise when projecting losses. Permit a brief discussion of “expected loss” math that may become more prevalent at community banks over the next decade.
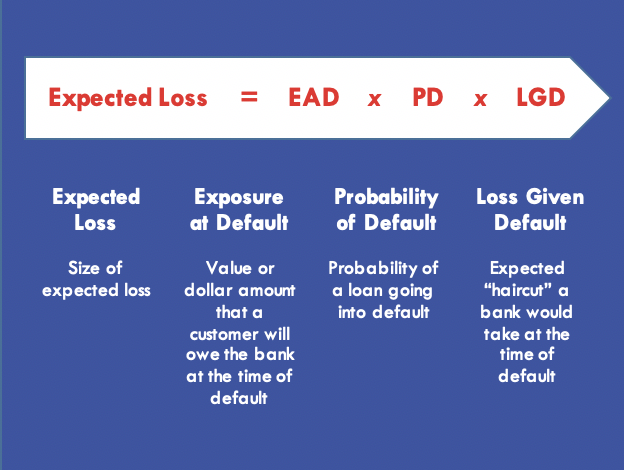
For a particular loan, an expected loss rate (EL rate) can be quantified by considering the probability that the loan defaults (PD, probability of default) and by considering the size of the net loss after collateral coverage if default occurs (LGD, loss given default). Specifically, the EL rate can be calculated by multiplying PD x LGD.
By further considering loan balance exposure at the time of default (EAD, exposure at default), we can calculate dollar expected losses (EL). Mathematically, dollar expected losses can be formalized as the product of these three factors as follows:
Risk Management Uses of Expected Loss Projections
Once calculated, projected expected losses have many potential risk management uses and we will briefly mention some potential risk management uses here:
- Regulatory capital adequacy testing. Expected losses (aggregated for all portfolios) can be subtracted from starting capital in each of the three Federal Reserve scenarios (baseline, adverse, and severely adverse) to see if capital is adequate to absorb potential credit losses and remain above regulatory “well-capitalized” levels.
- Internal capital adequacy testing. Quantitative results can be considered when evaluating internal capital limits above regulatory minimums for well-capitalized institutions.
- Capital planning support. Credit losses can be used in broader enterprise-wide stress testing and capital planning.
- Jointly managing credit and rate risk. If using an asset-liability management (ALM) system to implement expected credit losses, the interest rate information provided by the Federal Reserve for each scenario can be used to more seamlessly integrate financial risks (interest rate risk) and provide attribution analysis (identify how much is due to interest rate risk and how much due to credit risk).
- Recovery planning. The magnitude of credit losses can provide helpful information regarding any planned reverse stress testing (which notably is not yet performed or expected at even the largest U.S. banks), which is useful to create recovery playbooks should your organization unexpectedly drop below well-capitalized levels.
Potential Strategy Uses
Most community (and mid-sized) banks do not employ staff economists. So why not improve your budgeting process by considering the Federal Reserve’s annual baseline scenario—a tool that represents consensus economic opinions of private sector economists?
Note this: So far in 2014, this baseline economic projection (provided in November 2013) has been reasonably consistent with how the economy is actually unfolding. Specifically, the unemployment rate (an important variable in many statistical models) has been particularly accurate.
For those institutions that prepare three-year strategic plans, all three scenario “gifts” can be considered, including expected loss projections for each scenario.
The impact of strategic changes in loan mix can be quantified in advance with expected loss projections. More fundamentally, expected loss projections can be used to assess growth capacity and additional risk (loss) capacity.
Finally, a similar methodology of projecting expected losses can be used for potential acquisition targets to properly estimate losses under different economic situations.
Conclusion
Like Barry, I hope you rise to the emerging new credit stress testing standard and properly leverage risk quantification gifts. Good luck!
References
1 http://www.occ.gov/news-issuances/bulletins/2012/bulletin-2012-33.html
2 https://www.fdic.gov/regulations/examinations/supervisory/insights/sisum12/SIsmr2012.pdf
About the Author

As a consultant, Drew’s experience spans the spectrum from top Fortune 500 firms to very small firms. His advisory skills have been procured to lead asset liability management process improvements at large banks, including a global systemically important financial institution (GSIFI), and he consistently develops systems to help internal teams solve complex business problems at entities of all sizes.
During his extensive FDIC career, Drew’s asset liability management and credit knowledge was drawn upon to develop regulatory training materials used by multiple agencies, and he was a key contributor to 2007 “war game” simulations, creating scenarios similar to events that actually unfolded in late 2008.
Copyright © 2014 by Global Financial Markets Institute, Inc.
Download article